As block trading becomes more integrated into traders’ workflows and tariff-related uncertainty continues, there is an increasing focus on using dark trading tools efficiently to get the best price for large orders.
Putting dark block liquidity under the spotlight reveals the liquidity patterns and variability which exists in this growing area of the market. Traders will be familiar with the ebbs and flows of lit liquidity within EMEA and the increasing focus on the closing auction. For this deep-dive into block liquidity we take a top-down approach, starting with annual seasonality, peeling back each layer to analyse the trends on a monthly, weekly, and even hourly basis. The deeper we look, the greater the difference when compared to more traditional trading patterns.
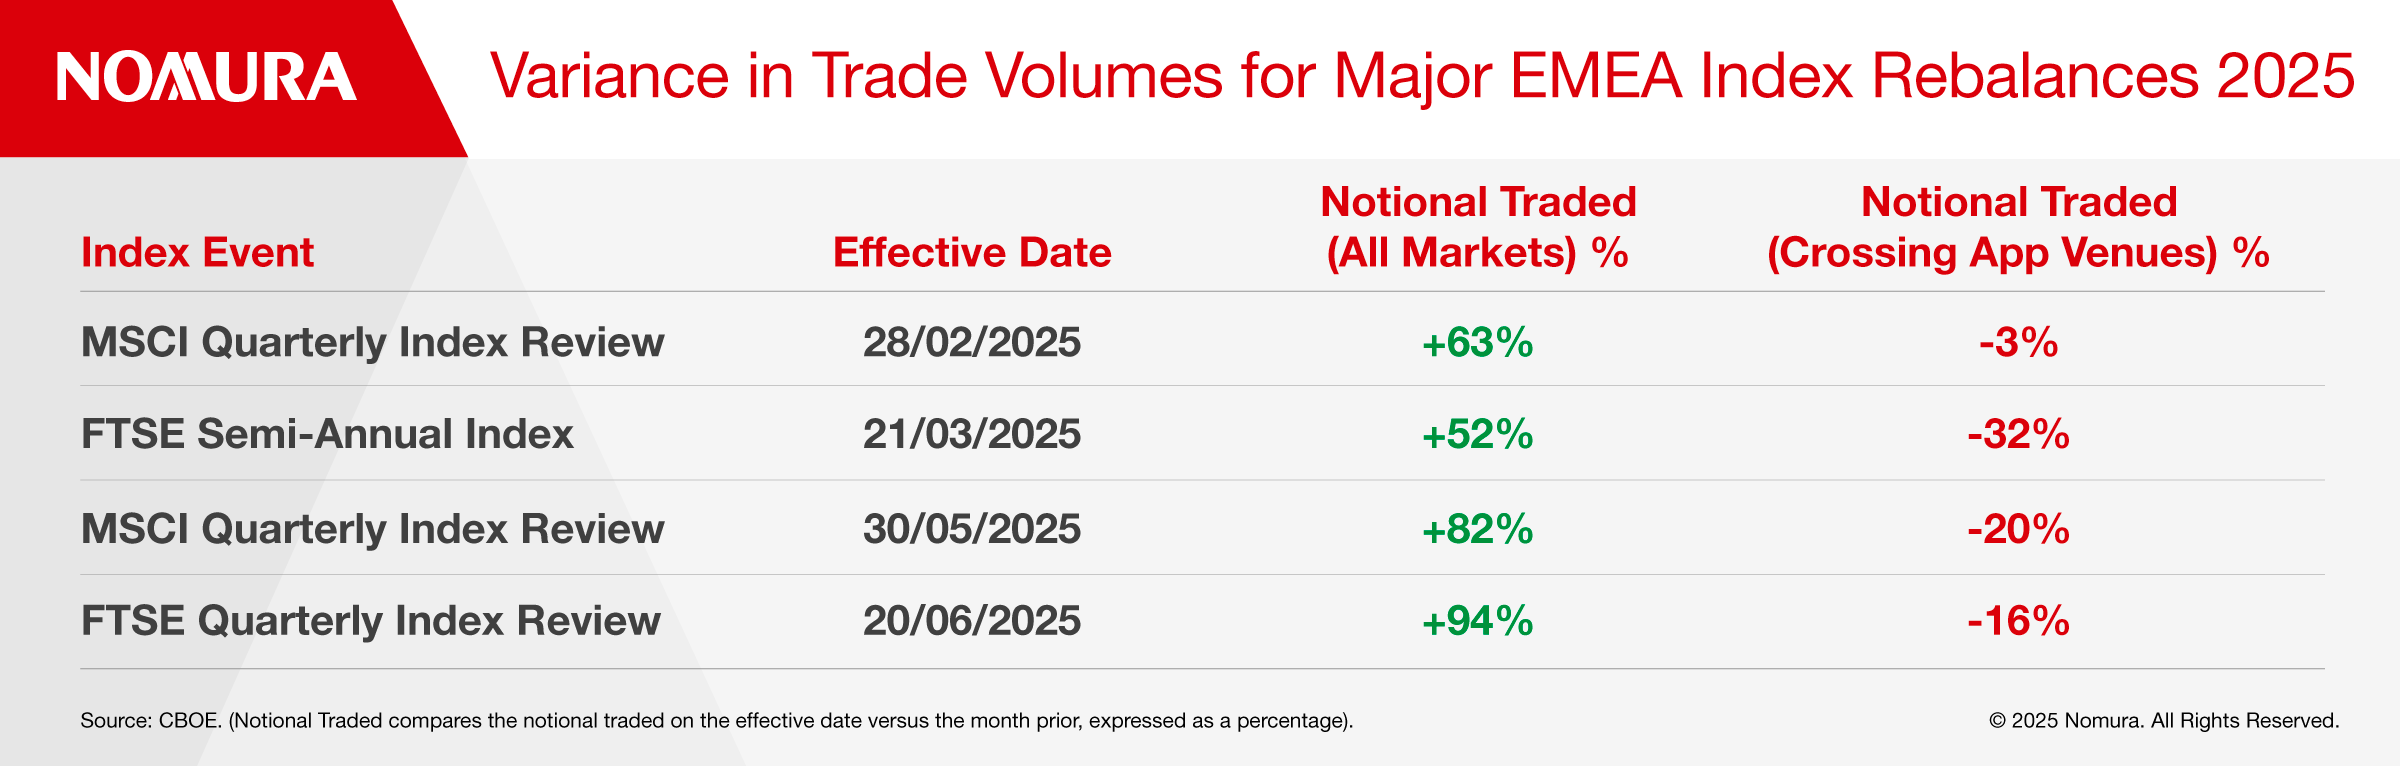
Starting with annual seasonality, the usual trends of bumper volumes during earnings season, financial year end and other cyclical macroeconomic events seem to align across both block trading and algorithmic trading, boosting the liquidity available in the market. Traders might be surprised to hear that there are certain events within the calendar year that are close to double the liquidity present in lit venues but leave little to no boost in liquidity within the dark block trading ecosphere.
The most obvious and recurring example of this would be the quarterly "index rebalances" flows, that traders heavily rely on as a liquidity event. When we analyse these key dates, for example the recent FTSE quarterly rebalance, the +94% uptick seen across all markets on the day is not mirrored in block trading, with crossing application venues reacting in the opposite direction, witnessing a -16% decrease in trading volumes versus the month prior to the effective date*. This means that traders sitting on illiquid orders on these key dates, will need to take advantage of the increased lit volumes, or accept the likelihood of having to rest an order in darks across further consecutive days.
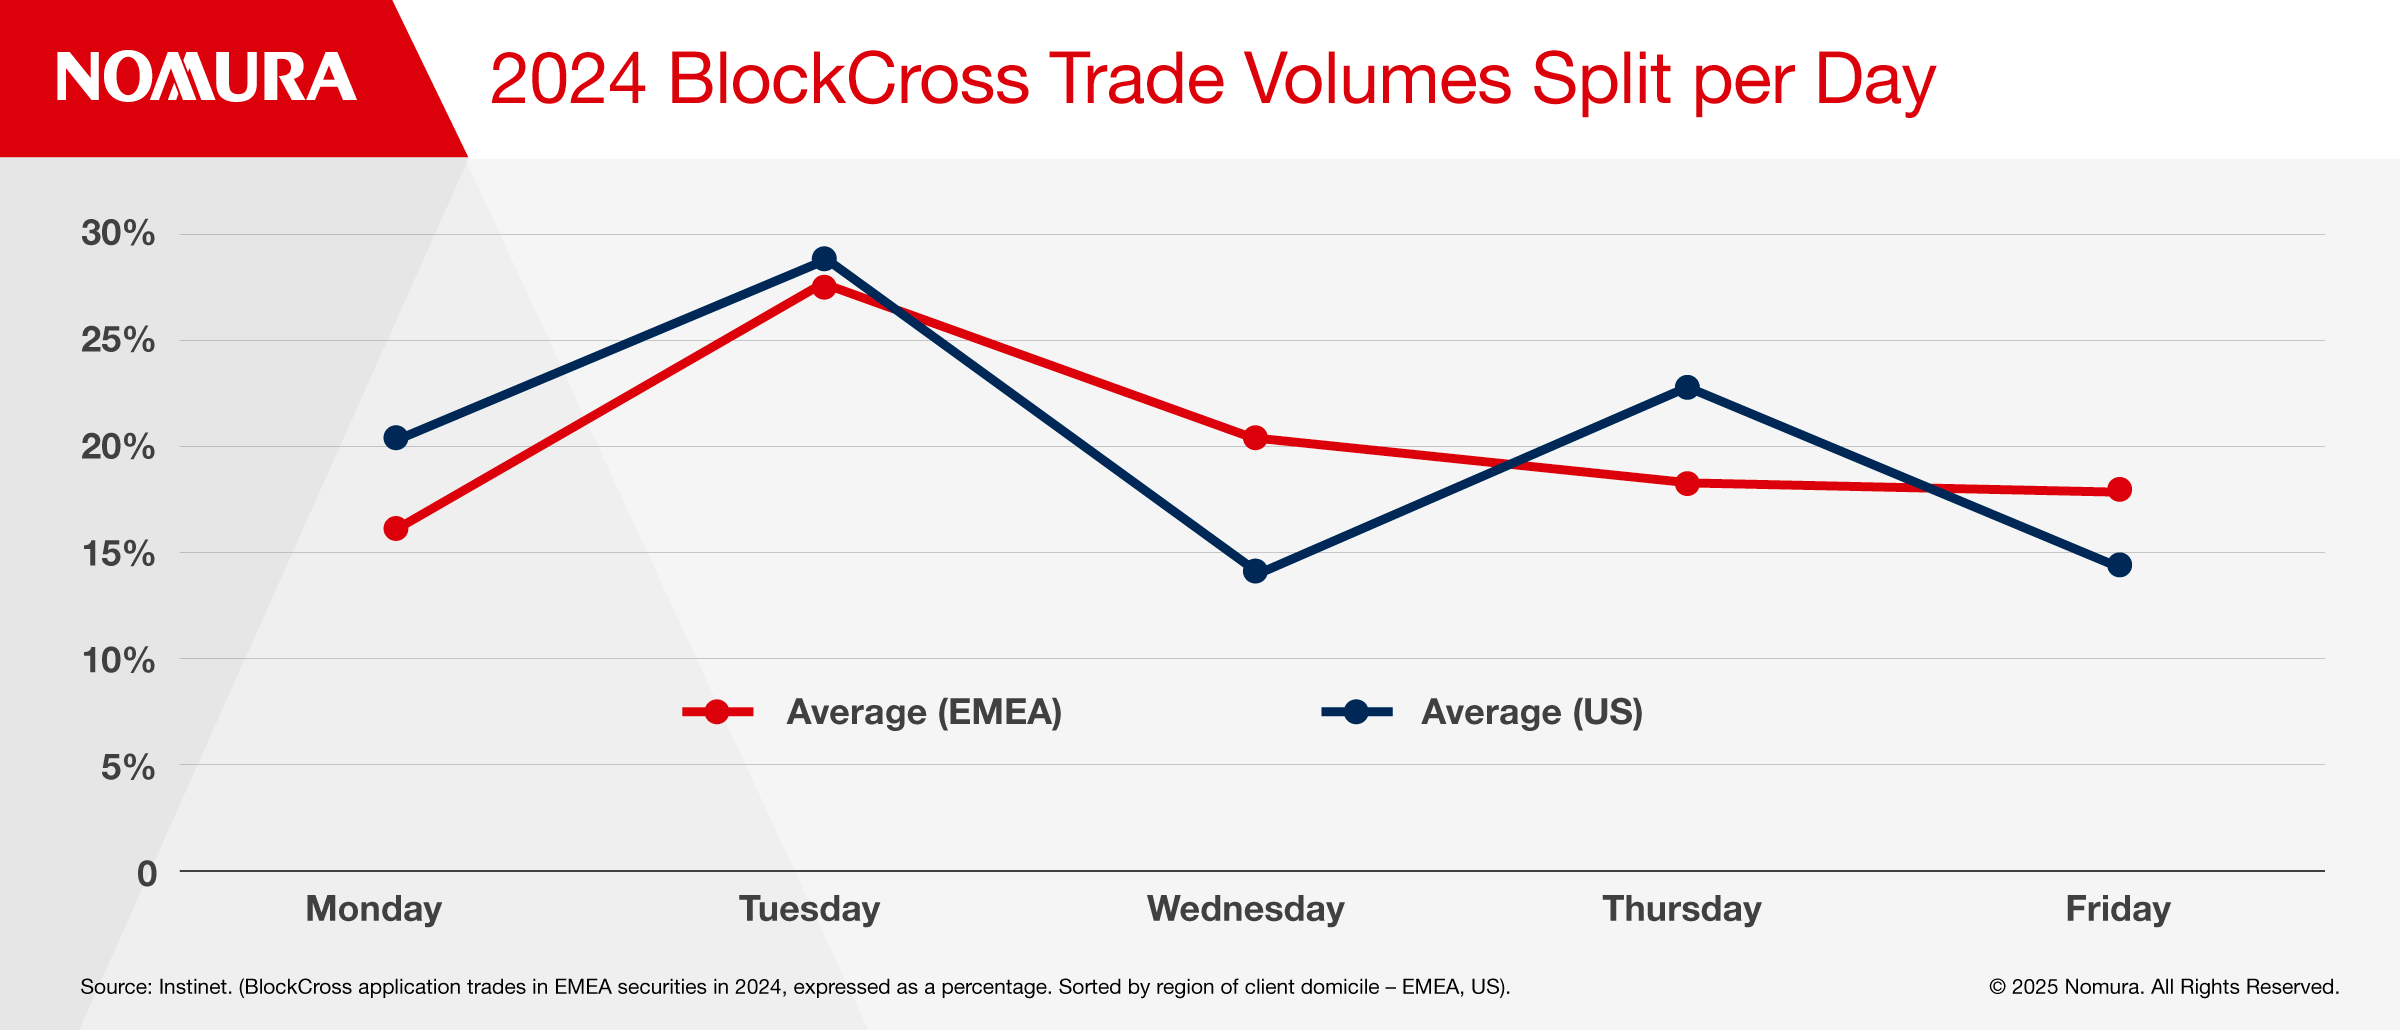
Block trading trends in EMEA become even more apparent when broken down into each session of the trading week. As illustrated in the graph below, across the whole of 2024, one day of the week stood out for block trading – Tuesday. BlockCross, on average, traded 28% of its flow on Tuesdays, with the remaining days receiving between 15%-20% of the total flow. This Tuesday uptick versus Monday likely relates to the Americas time-difference, where EMEA portfolio managers prefer to wait for US dealers to digest the macroeconomic news of the weekend and then add to the available block liquidity.
Dealing a large block at the wrong price can significantly impact performance, therefore removing any weekend risk seems to be an attractive option when trading blocks throughout the week. This coupled with a bookended ‘work from home effect,’ with Monday and Friday (on average) two of the lowest points on the graph, could also be driving some of the variability in volume.
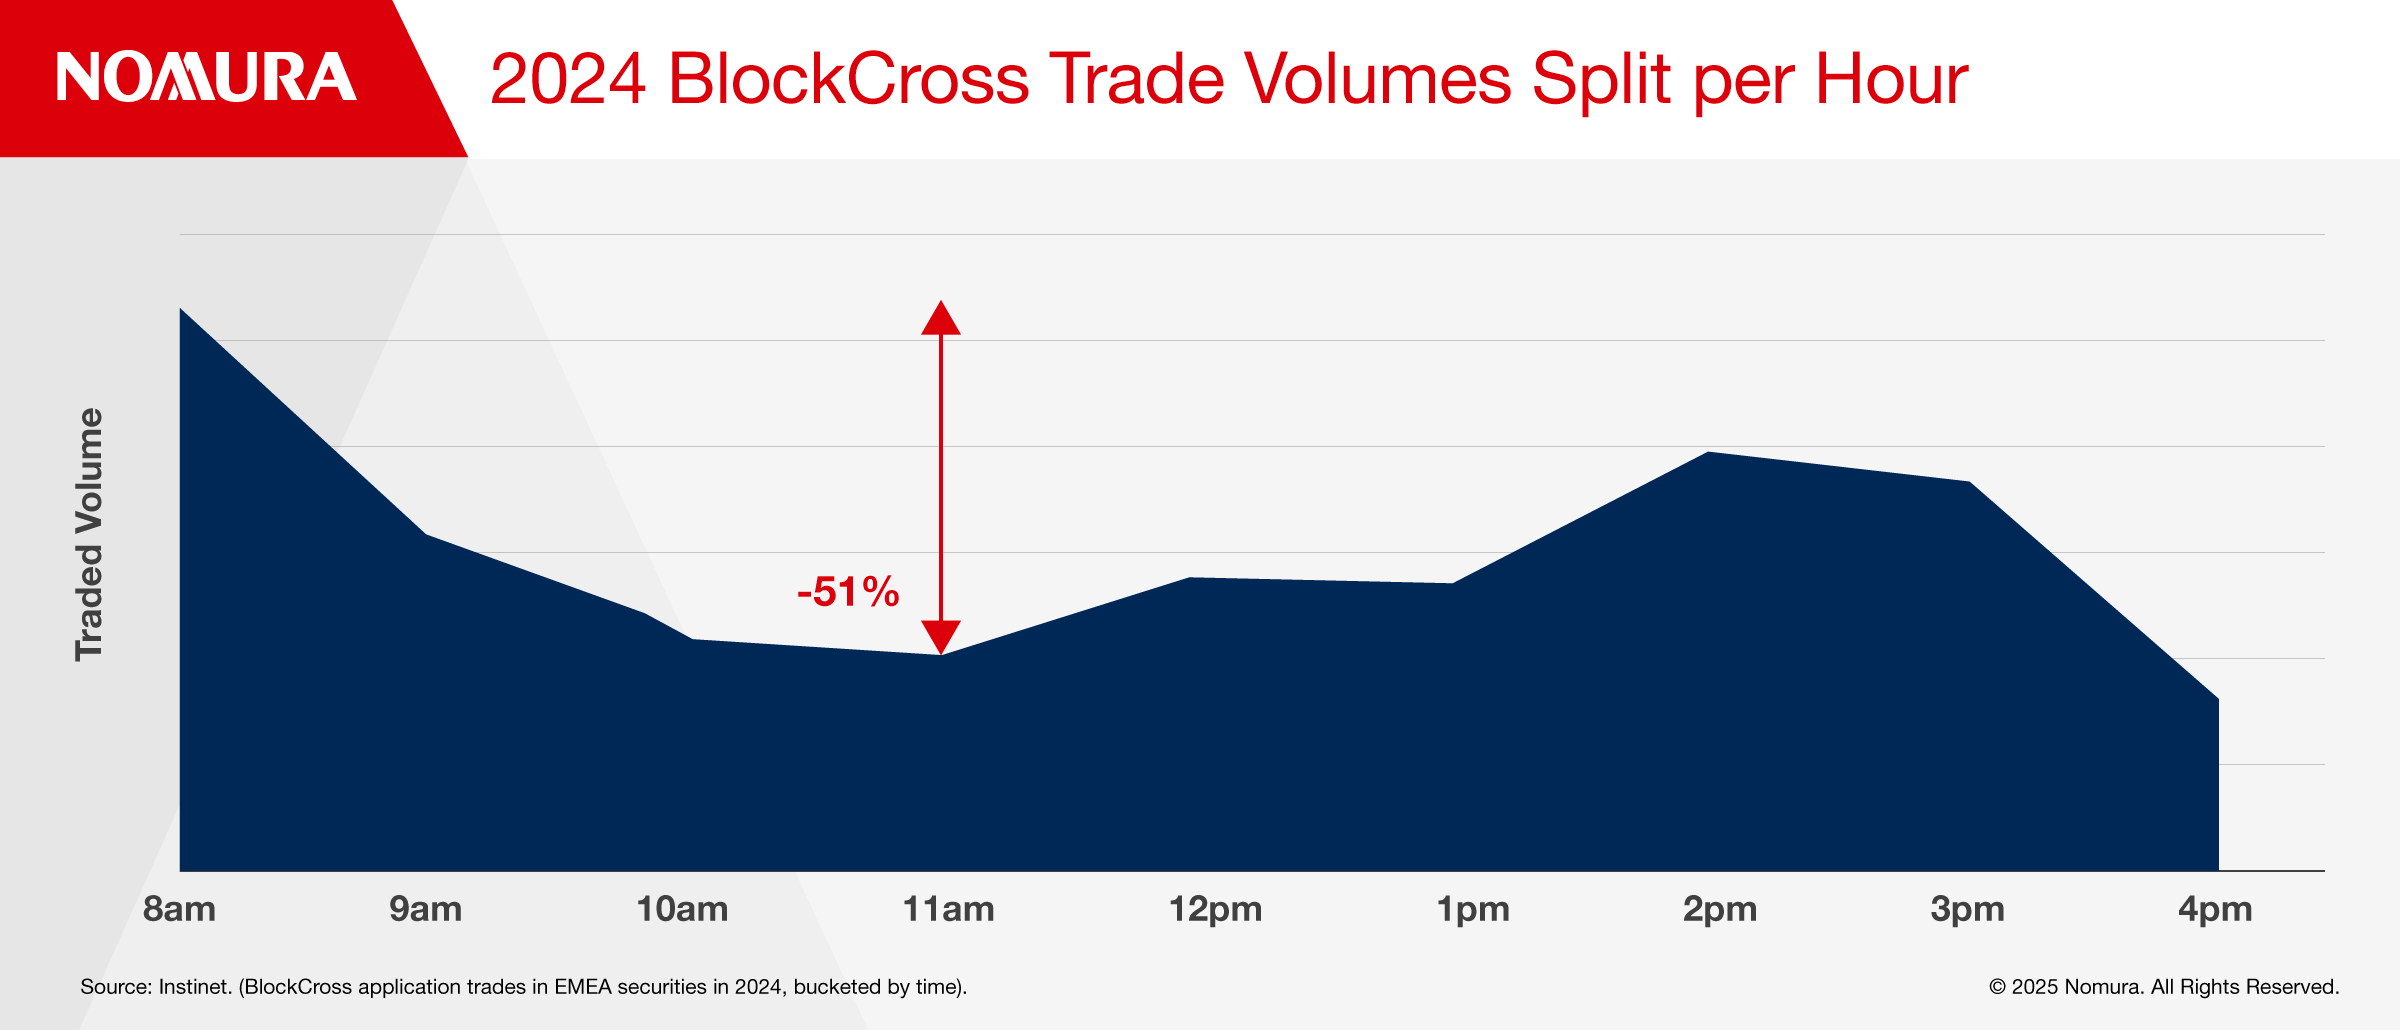
Now that we have identified the most bountiful days of the week to seek a block, it makes sense to look at which times of the day are driving block volumes. The graph below examines BlockCross trade volumes hour-by-hour (GMT) across the whole of 2024. The data shows an initial spike in liquidity between 8am – 9am which tapers off as traders route orders onward and start to get filled on their illiquid orders. This tapering ceases between 11am – 12pm, starting to gradually climb once more, peaking between 2pm – 3pm. The time period 4pm – 4:30pm only covers half an hour, so this volume is not a true like-for-like comparison.
This block trading resurgence is caused by the fact that a significant number of asset managers don’t have regionalised trading, and the American-domiciled houses start to log-in and add new European liquidity into the mix from midday onwards. This surge lasts for three hours and continues into the afternoon session right up to the closing auction. This execution pattern has been observed consistently in the block trading space over several years and marks a stark difference from the usual midday lull and final closing auction surge that can be witnessed in lit markets.
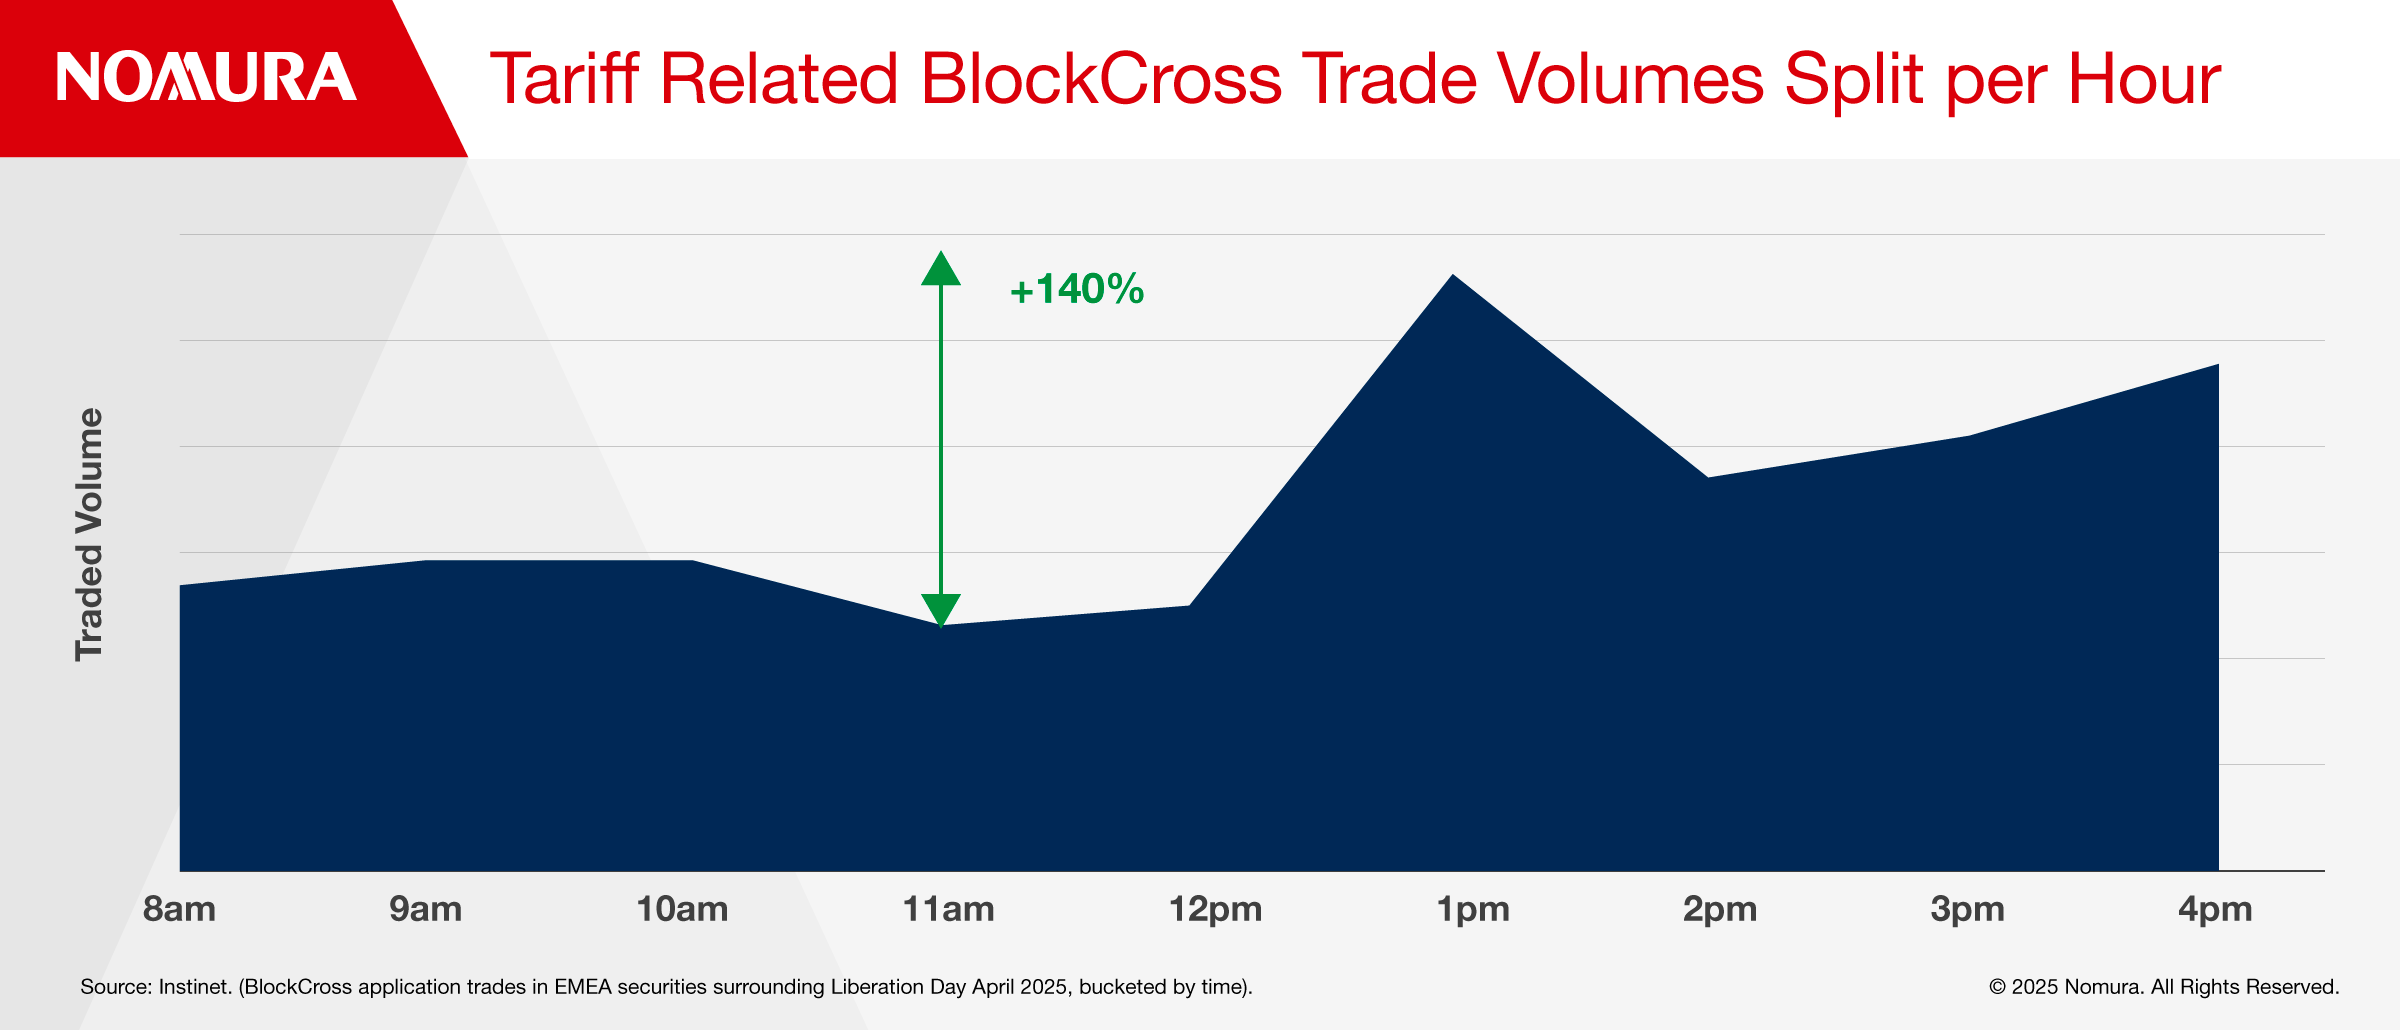
The only time we witnessed a deviation from these patterns was during the recent tariff-related volatility that rocked global markets. Comparing days of the week has too much of a news-related bias, therefore the main focus was to look at how traders and portfolio managers changed their hourly block trading patterns during recent volatile episodes.
We therefore analysed the first two weeks of April (Liberation Day was 2 April) to see how market participants had changed their block trading appetite over this period. The immediate difference shown in the graph below was a reduction in the early hours crossing of blocks, and a considerable back-loading of liquidity into the overlapping market hours between EMEA and the Americas. This suggests that price uncertainty remained high before the US market opened, as traders wanted to avoid blocking at the wrong level before any potential market-moving news coming out of the US.
Looking ahead to the rest of the year, we will likely see a number of similar ‘flashpoints’ originating from the Americas, where block trading appetite pivots to the afternoon session.
A version of this article was first published in The Trade.
For more information on this topic, please contact Alex Wicks