As a wave of money rushes towards green funds, investors may wish to cast a critical eye on fund ‘greenwashing’ which embellishes an investment’s ethical credentials even though it barely provides any ESG advantage compared to its benchmark.
In the U.S., ESG fund assets under management reached $330 billion in September 2021, up from $236 billion at the end of 2020, according to Morningstar Direct, leaving investors vulnerable to buying products which don’t do what they say on the tin.
Here, we outline metrics to detect fund Greenwashing while assessing how much benchmark-relative risk these funds take and whether that extra risk translates into ESG advantage over benchmark.
When buying an ESG fund, investors need to ask themselves how much ESG advantage the fund represents compared to its benchmark index or compared to other ESG funds.
The ESG Advantage
Figure 1 shows the ESG ratings for the S&P 500, and other ESG-focused investments. Fund H (blue line) is the largest equity fund by assets with an ESG focus, and it’s benchmarked to the S&P 500. Fund F (grey line) is another ESG equity fund benchmarked to the S&P 500. The green line is an ESG overlay applied to the S&P 500 Index that we introduced earlier this year. It’s a portfolio that overweights good ESG companies relative to industry group peers and underweights bad ESG companies, based on consensus company ESG ratings.
A fund/portfolio’s ESG rating is calculated as the weighted company ESG rating. And a company’s ESG rating is a consensus-based industry group relative score (company’s consensus ESG percentile rank within its industry group). The consensus-based company ESG rating is provided by OWL Analytics.
The S&P 500 benchmark ESG rating has been around 64th percentile in recent years. This means the portfolio as a whole beats 64% of companies in the benchmark in terms of ESG quality, on an industry group relative basis. Fund H’s ESG rating has generally not exceeded the benchmark by much. Fund F has a rating around 72. Its
ESG Advantage, as measured by fund ESG rating minus benchmark ESG rating, is 8. This means the ETF, which tracks the S&P 500 ESG Index, beats only about 8% more companies in terms of ESG than the standard S&P 500 benchmark. The ESG Overlay S&P 500 has a rating of around 84, meaning it beats 20% more companies on ESG than the S&P 500 benchmark.
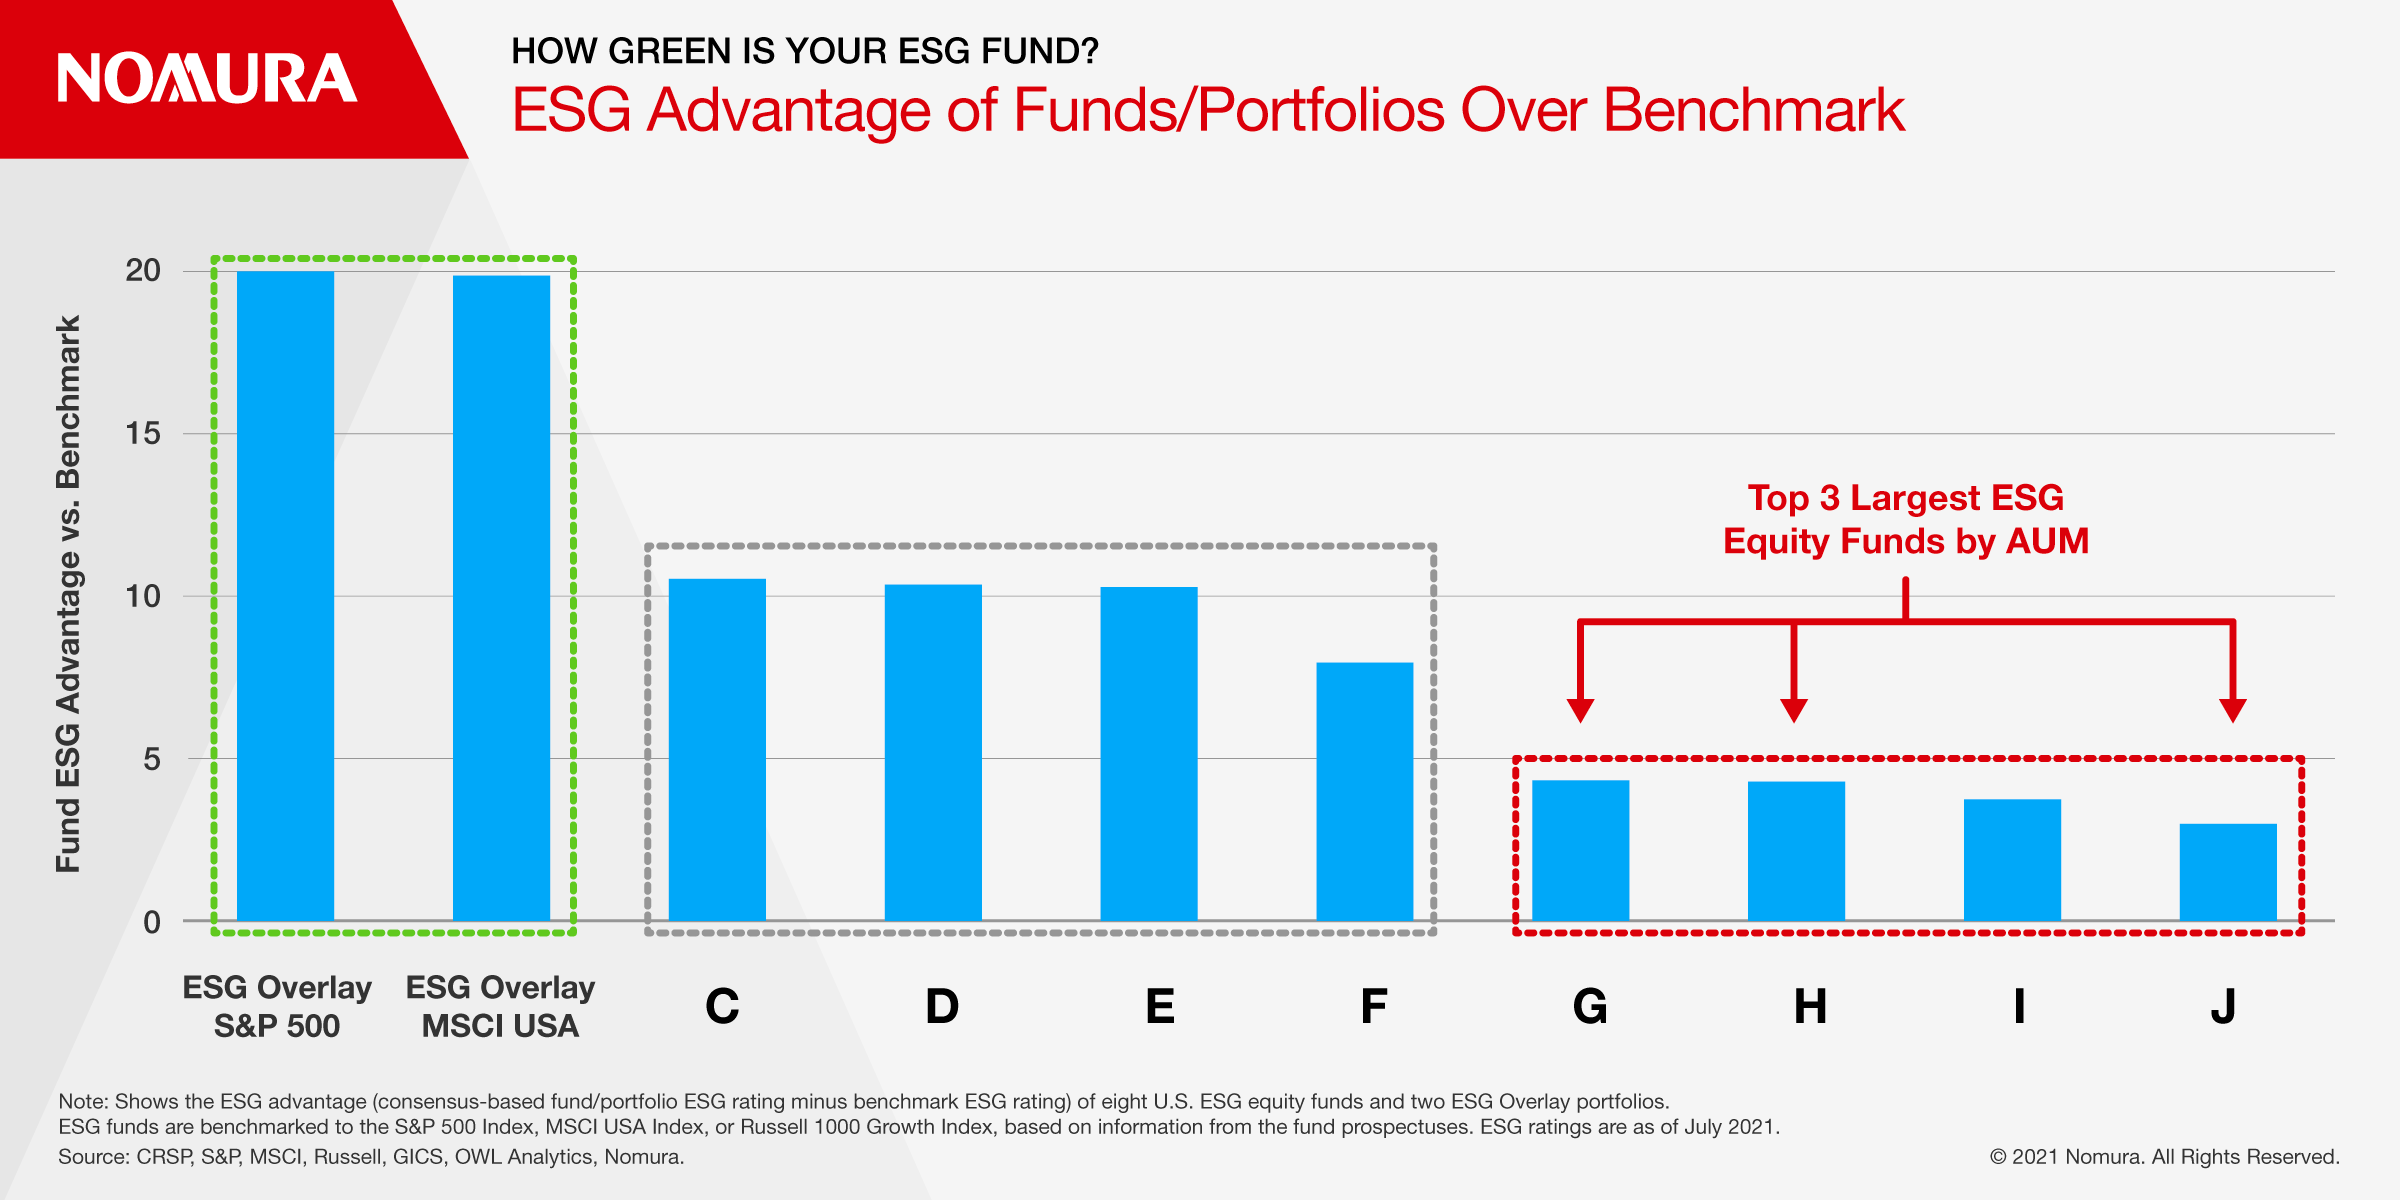
Figure 2 broadens the set of funds in the analysis and shows the current ESG advantage of eight U.S. ESG equity funds with assets ranging from about $1billion to $30 billion. The bars in the chart indicate the difference between a fund’s ESG rating and its benchmark’s ESG rating. The eight U.S. ESG equity funds are benchmarked to the S&P 500 Index, the MSCI USA Index, or the Russell 1000 Growth Index, according to fund prospectus information. The chart shows that the 3 largest funds by assets offer the least ESG advantage, beating only about 3-4% more companies in ESG quality than their corresponding benchmarks. The tier of funds in the middle of the chart, boxed in gray, offer more than double the ESG advantage of the tier of funds on the right. But that’s still only about half the advantage of our ESG Overlay portfolios, shown on the left.
Risk vs. ESG Advantage
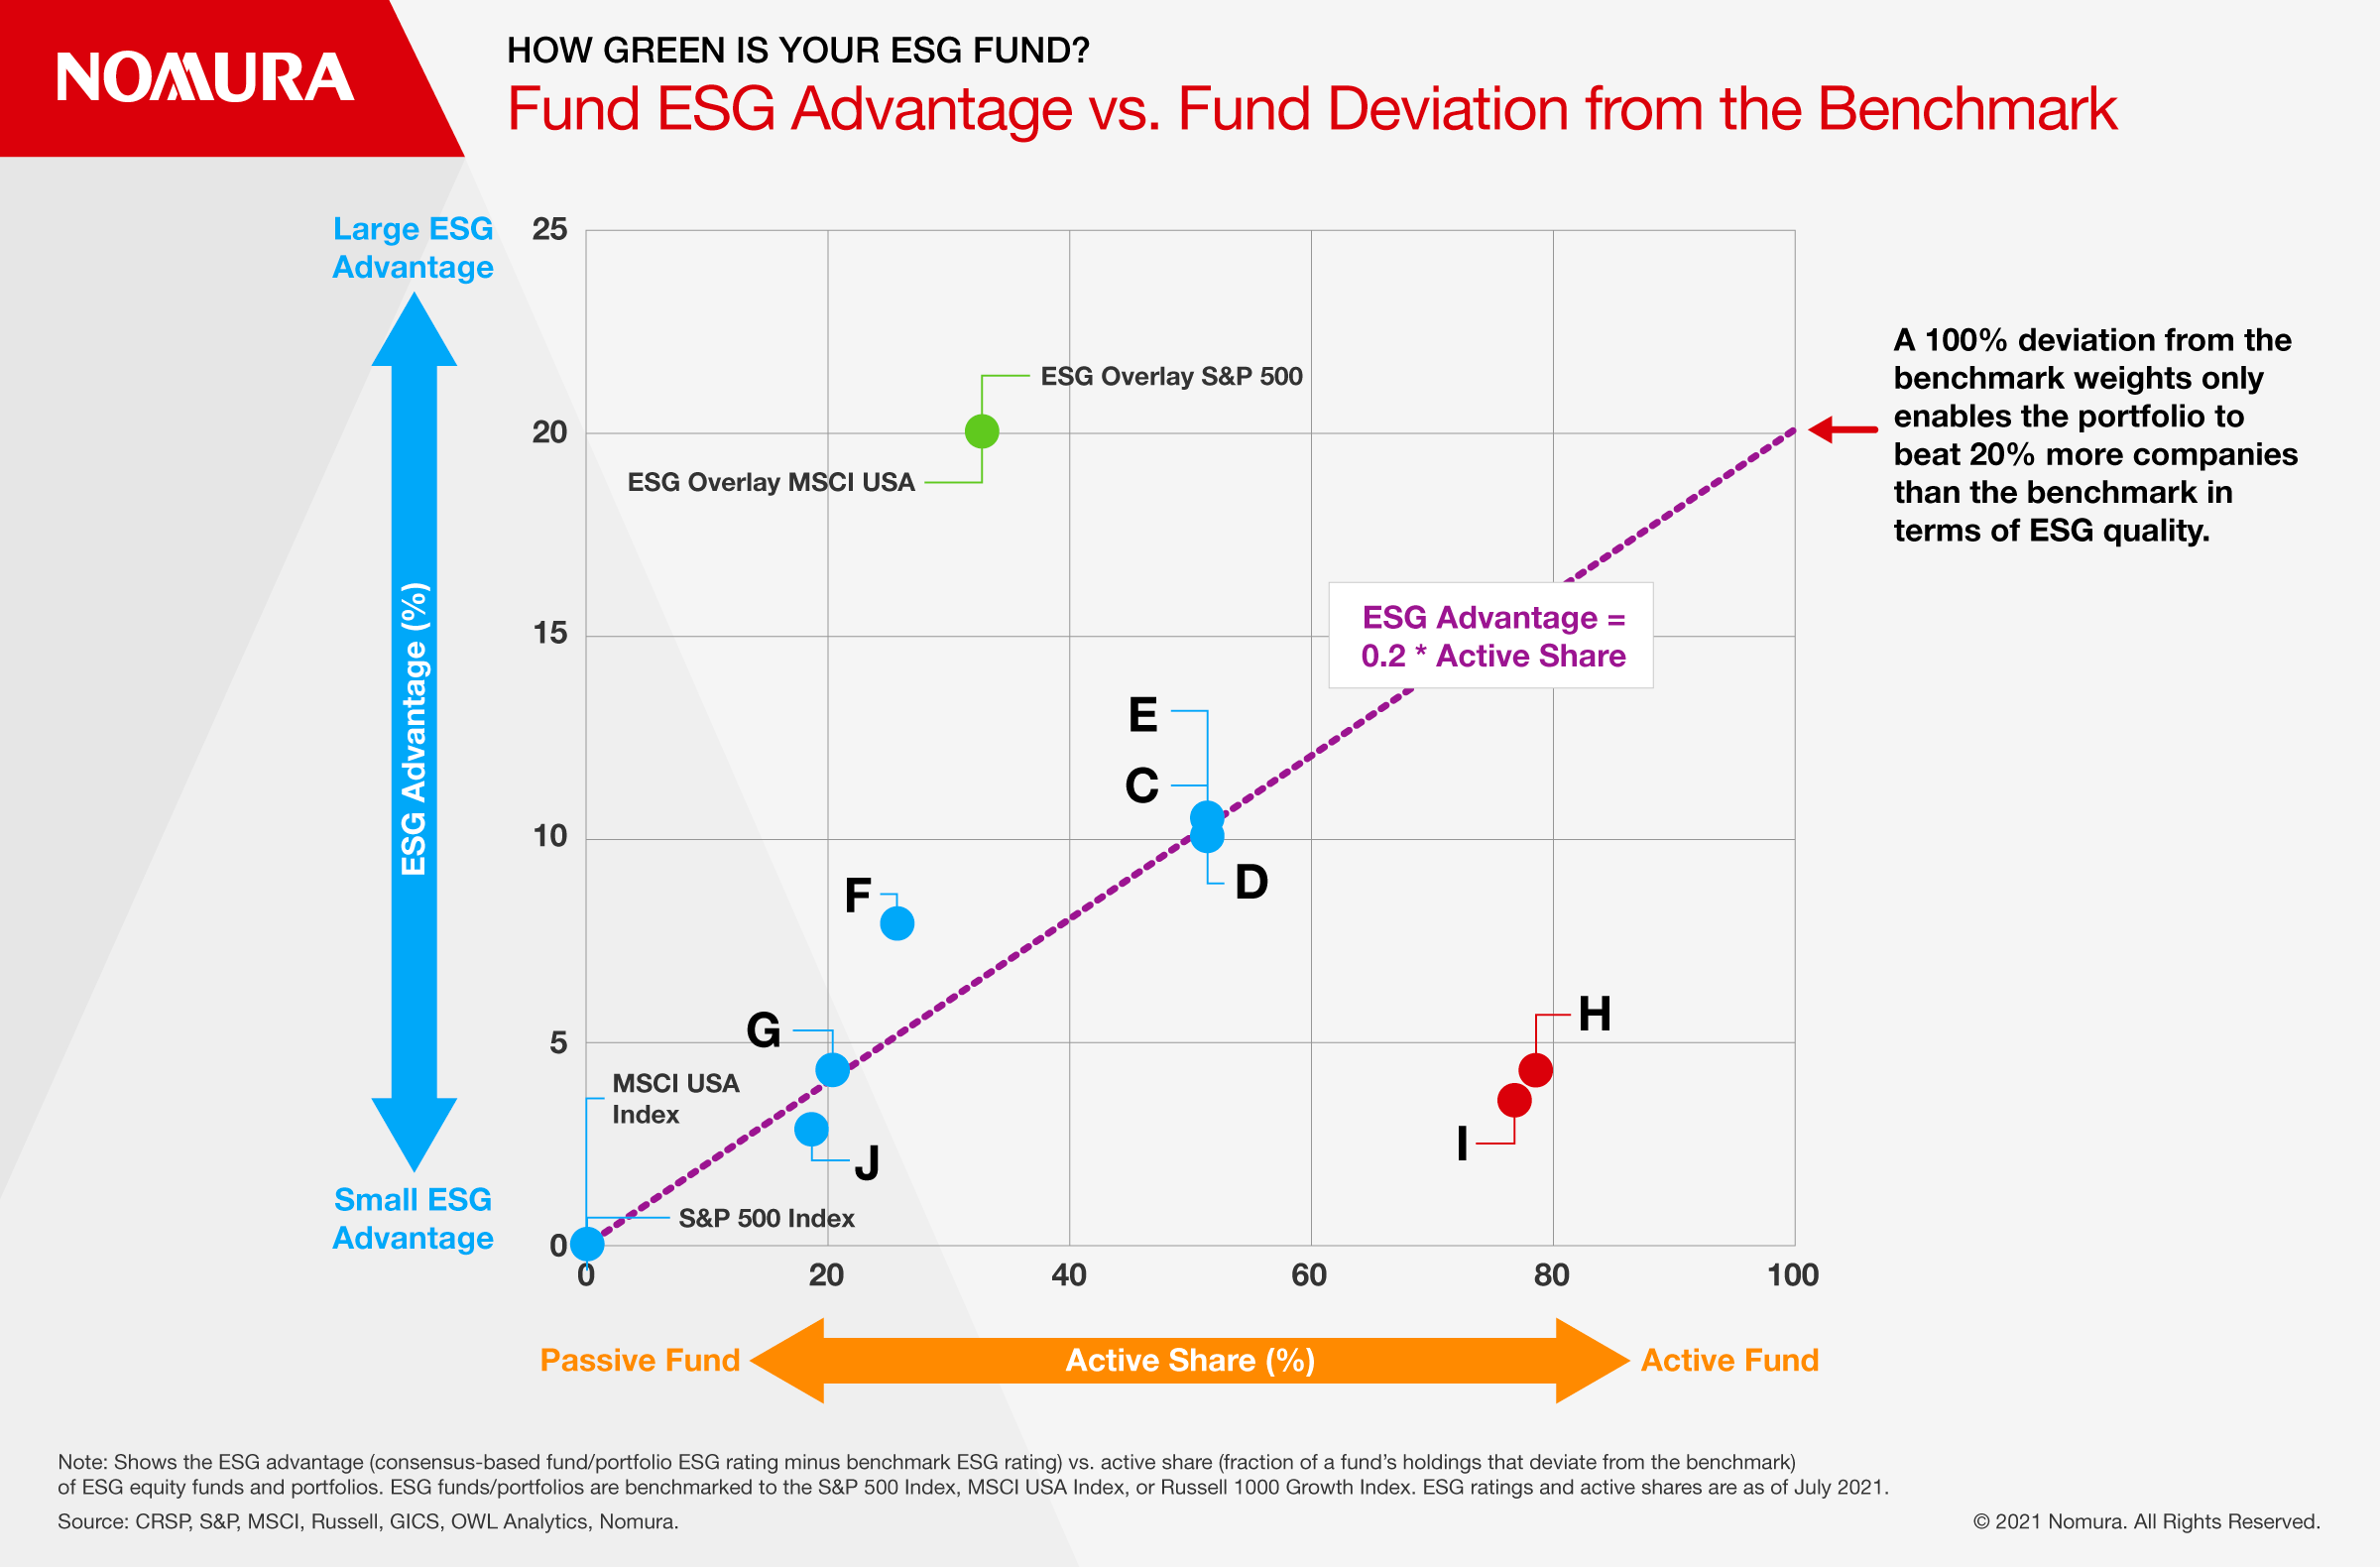
Even if a fund achieves a decent ESG advantage, there’s another important factor to consider – the risk taken by the fund. Any fund that claims better ESG credentials than its benchmark must deviate from that benchmark to achieve that. To visualize how much benchmark-relative risk the fund takes to achieve its ESG advantage, the scatter plot in Figure 3 shows the ESG advantage (vertical axis) and the active share (horizontal axis) of the funds/portfolios above. A fund’s active share measures the fraction of the fund’s holdings that deviate from its benchmark index.
The S&P 500 and MSCI USA benchmarks are at the lower left corner, as they have zero ESG advantage and zero active share. The purple dashed line shows a linear-fitted line between ESG advantage and active share for most of the funds (excluding outliers), represented by the blue dots. Outliers are the red dots on the lower right, representing Funds H and I, and the green dots on the upper left, showing our ESG Overlay portfolios on the S&P 500 Index and MSCI USA Index.
The fitted line indicates that for the set of six funds around the line, ESG advantage achieved is approximately 0.2 times active share taken by the funds. Extrapolating on this, the red arrow at the right edge of the chart shows that a fund with an active share of 100%, one that has absolutely no overlap with its benchmark, would only achieve an ESG advantage of 20 over the benchmark. In other words, it would beat 20% more companies than the benchmark in terms of ESG quality. The ESG Overlay strategies (green dots) achieve about the same level of ESG advantage but with dramatically lower benchmark-relative risk – only 30% active share. Funds H and I (red dots) have almost 80% active share yet very little ESG advantage.
Superior Performance
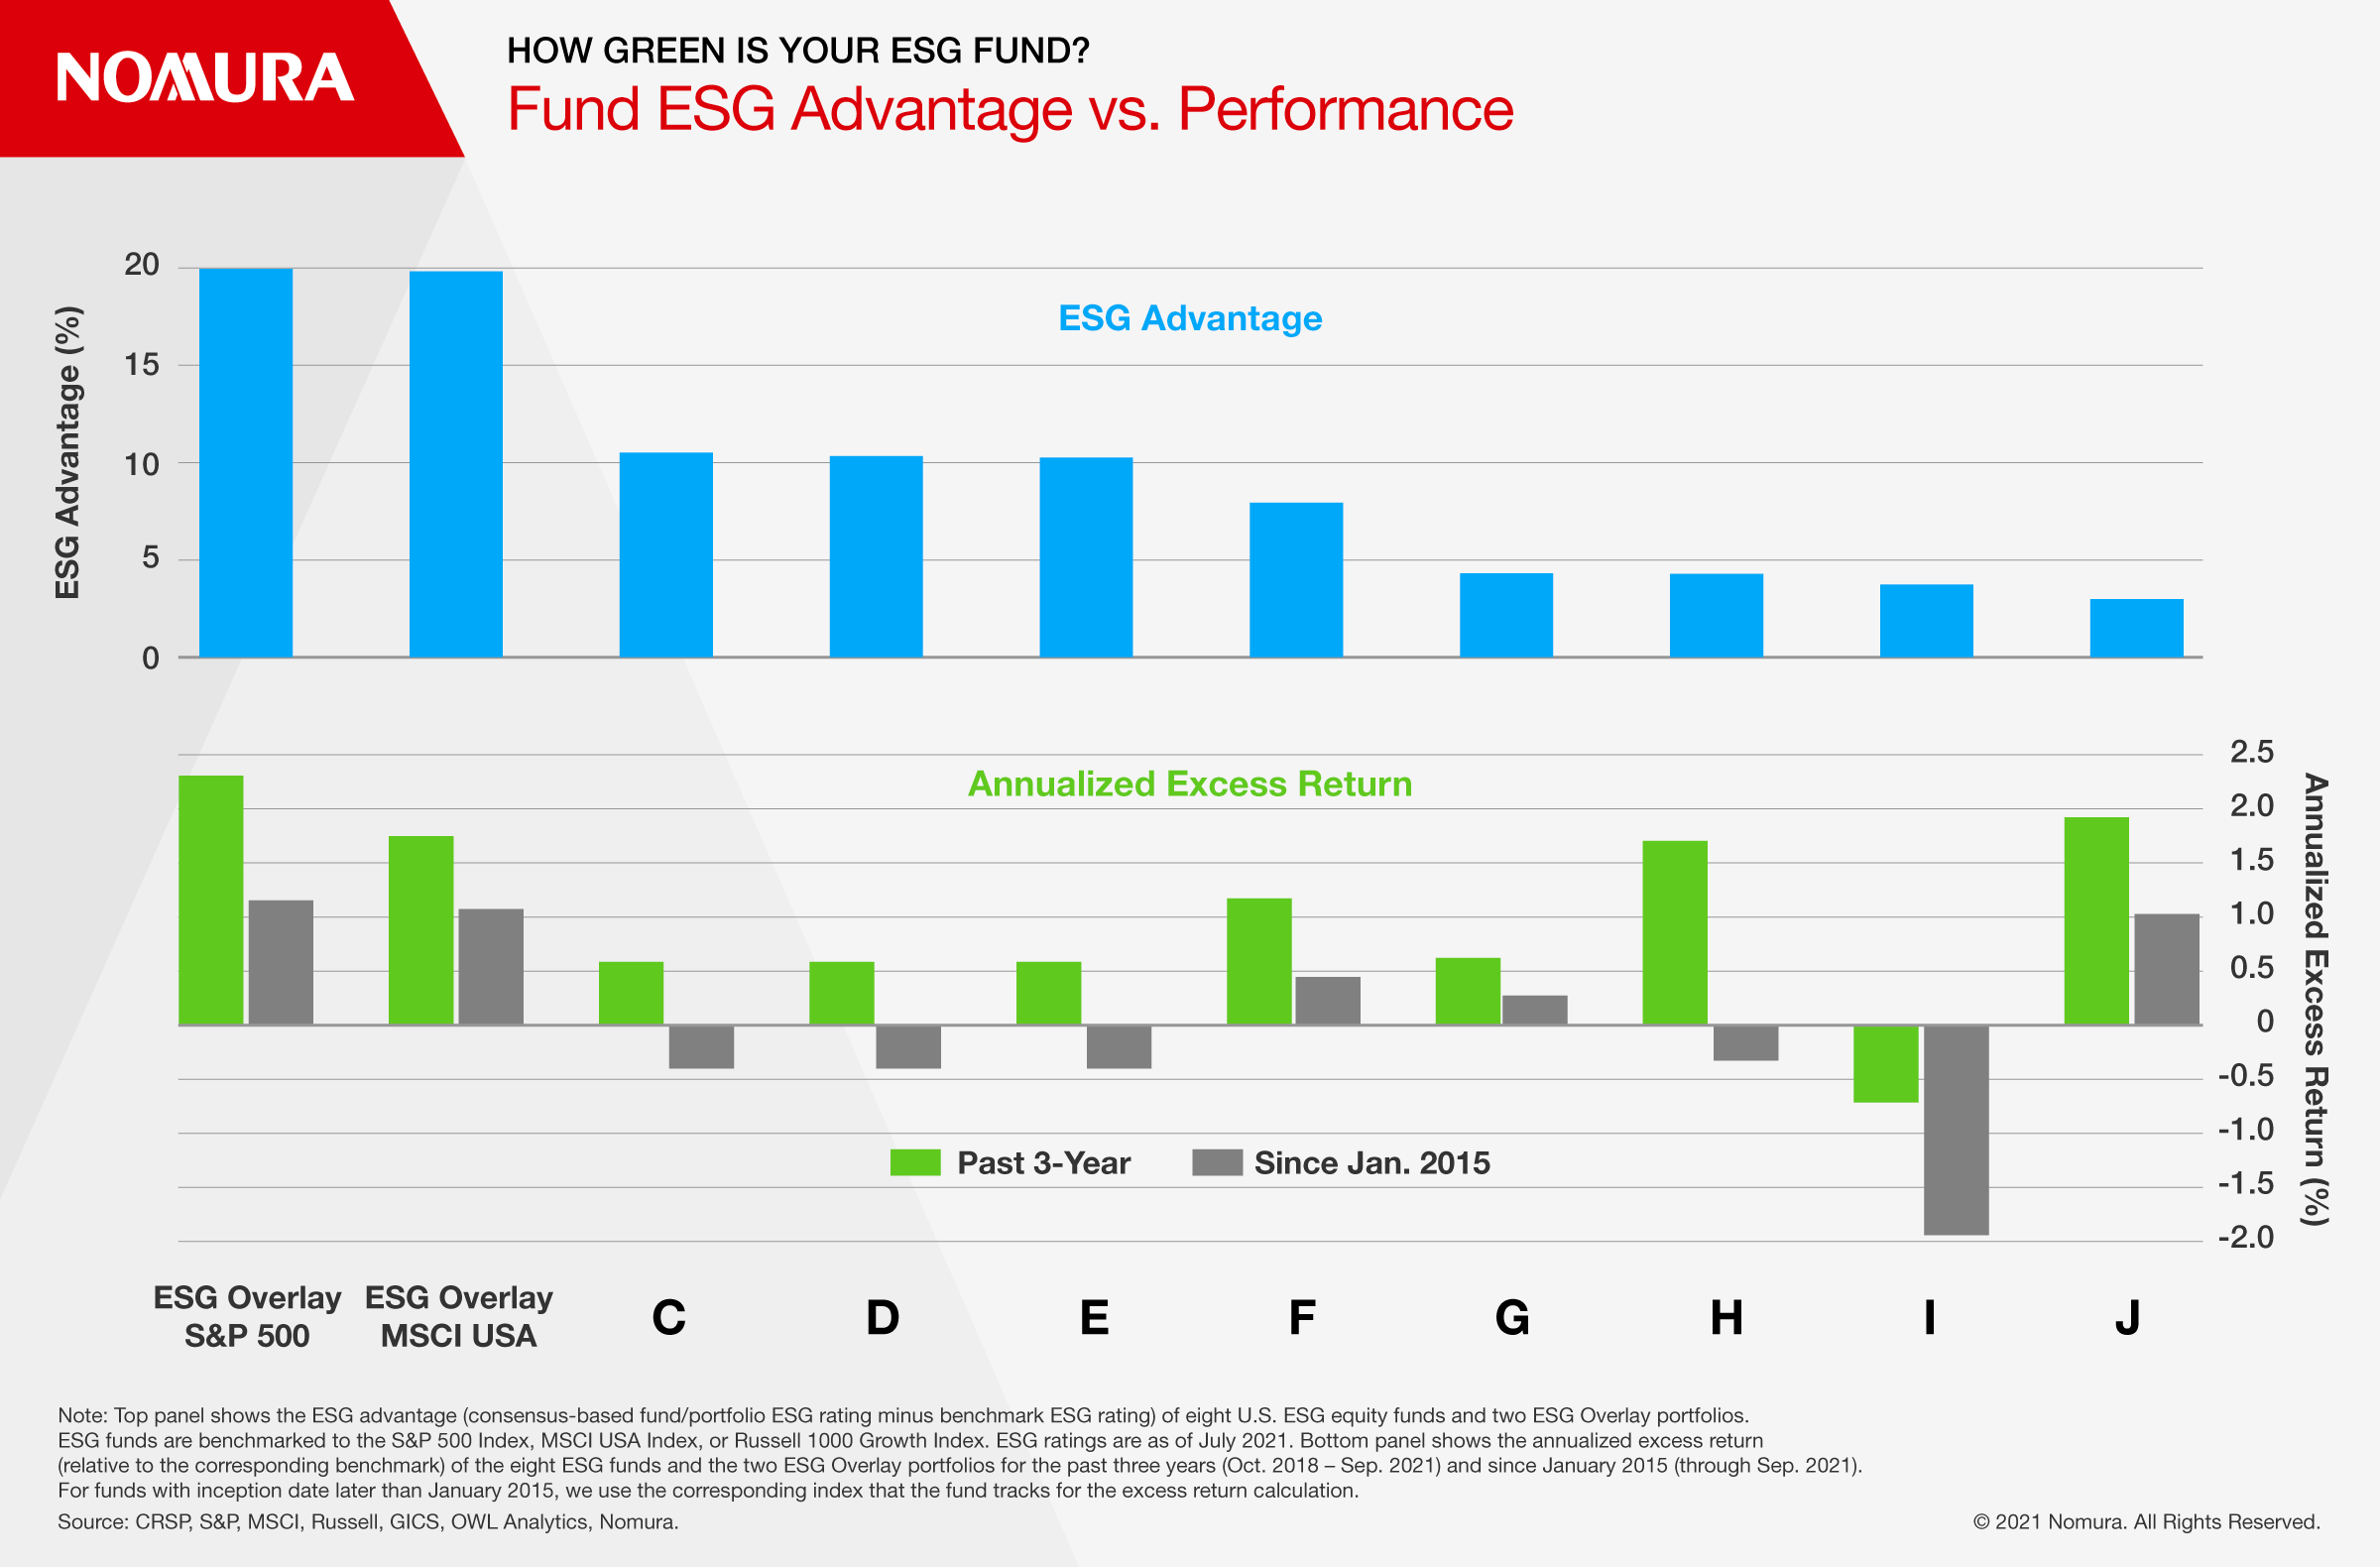
The ESG Overlay portfolios (green dots in Figure 3) provide superior ESG qualities with modest benchmark-relative risk, but do they sacrifice returns to achieve this? The top panel of Figure 4 plots the ESG advantage of the eight U.S. ESG equity funds we analyzed and our two ESG Overlay portfolios. The bottom panel of Figure 4 shows their 3-year and nearly-7-year annualized excess returns, highlighting that the ESG Overlay portfolios do provide alpha. The ESG Overlay for the S&P 500 has provided 2.3% annualized excess return over the past three years, while the MSCI version provided 1.8%. The annualized excess returns for these two ESG Overlay strategies since January 2015 was about 1.1%. Interestingly, excess returns for all the ESG funds featured in Figure 4 improved over the past three years. The results don’t indicate that ESG funds generally outperformed their benchmarks over a longer period (since 2015). But the ESG Overlay approach did outperform, while providing superior ESG advantage.
Conclusion
There’s a huge variability in ESG quality among ESG funds with some taking substantial benchmark-relative risk to achieve a minimal ESG advantage. These funds deviate considerably from their benchmark, yet they are “benchmarkhugging” in terms of ESG advantage.
Earlier this year, we introduced an ESG Overlay technique that re-weights each company relative to industry group peers in the S&P 500 Index according to its consensus ESG rating. Here, we’ve shown that this strategy achieves excellent ESG advantage with modest benchmark-relative risk – a notably better ESG profile than the alternatives analyzed here. Moreover, the ESG benefit comes with a 2.3% annualized excess return over the S&P 500 benchmark for the past three years, showing that you can do well while ‘doing good’
The metrics we’ve introduced and applied to the sample of eight ESG funds considered here show reason for caution. The ESG label on the tin doesn’t tell you enough about the ESG quality of the ingredients inside.
Read more on ESG fund analysis by clicking the link on the right or below to download full report.