
Rates | 5 min read June 2021

Economics | 9 min read | April 2021
UK Housing Market: Boom or Bust?
An outlook for the UK's housing market, weighing the positives against the negatives
Economics | 9 min read | April 2021
An outlook for the UK's housing market, weighing the positives against the negatives
The UK housing market enjoyed a period of strong growth in the second half of last year, as policy responses to the COVID-19 pandemic, alongside a general desire for space pushed up transactions and prices. But where do we go from here?
In answer to the question in the title, we expect neither a boom nor a bust in the UK housing market. Rather we expect the market to be propped up in the very near term by fiscal and monetary policy among other factors, then slow – not crash – from later in the year and beyond.
But let’s rewind a little, towards the end of last year UK housing market analysts were gloomy about this year’s outlook. In fact people across the UK were generally gloomy, with virus case numbers moving in the wrong direction, and although the November lockdown was lifted in December it was followed by yet another (rather expected) lockdown in early January.
To be sure, the negative mood surrounding the real estate market did have some basis, and indeed some of the downside risks to the housing market (rising unemployment, rising mortgage interest rates, high mortgage products loan-to-value (LTV) ratios) remain in place, even now.
To focus on these issues exclusively would ignore some of the key market supports. But before we consider the prospects for the market, let’s look at where it’s at.
House price inflation started rising meaningfully towards the end of last summer, when the virus was in remission and the Chancellor of the Exchequer had announced a temporary cut to stamp duty to take effect on 8 July.
The cut led to the number and value of mortgage approvals reaching their highest levels since before the global financial crisis, which on the face of its suggests that activity in the housing market more than made up for the spring downturn. The annual price growth on UK properties also rose from 1.3% in June to around 6% on average in the six months to February this year.
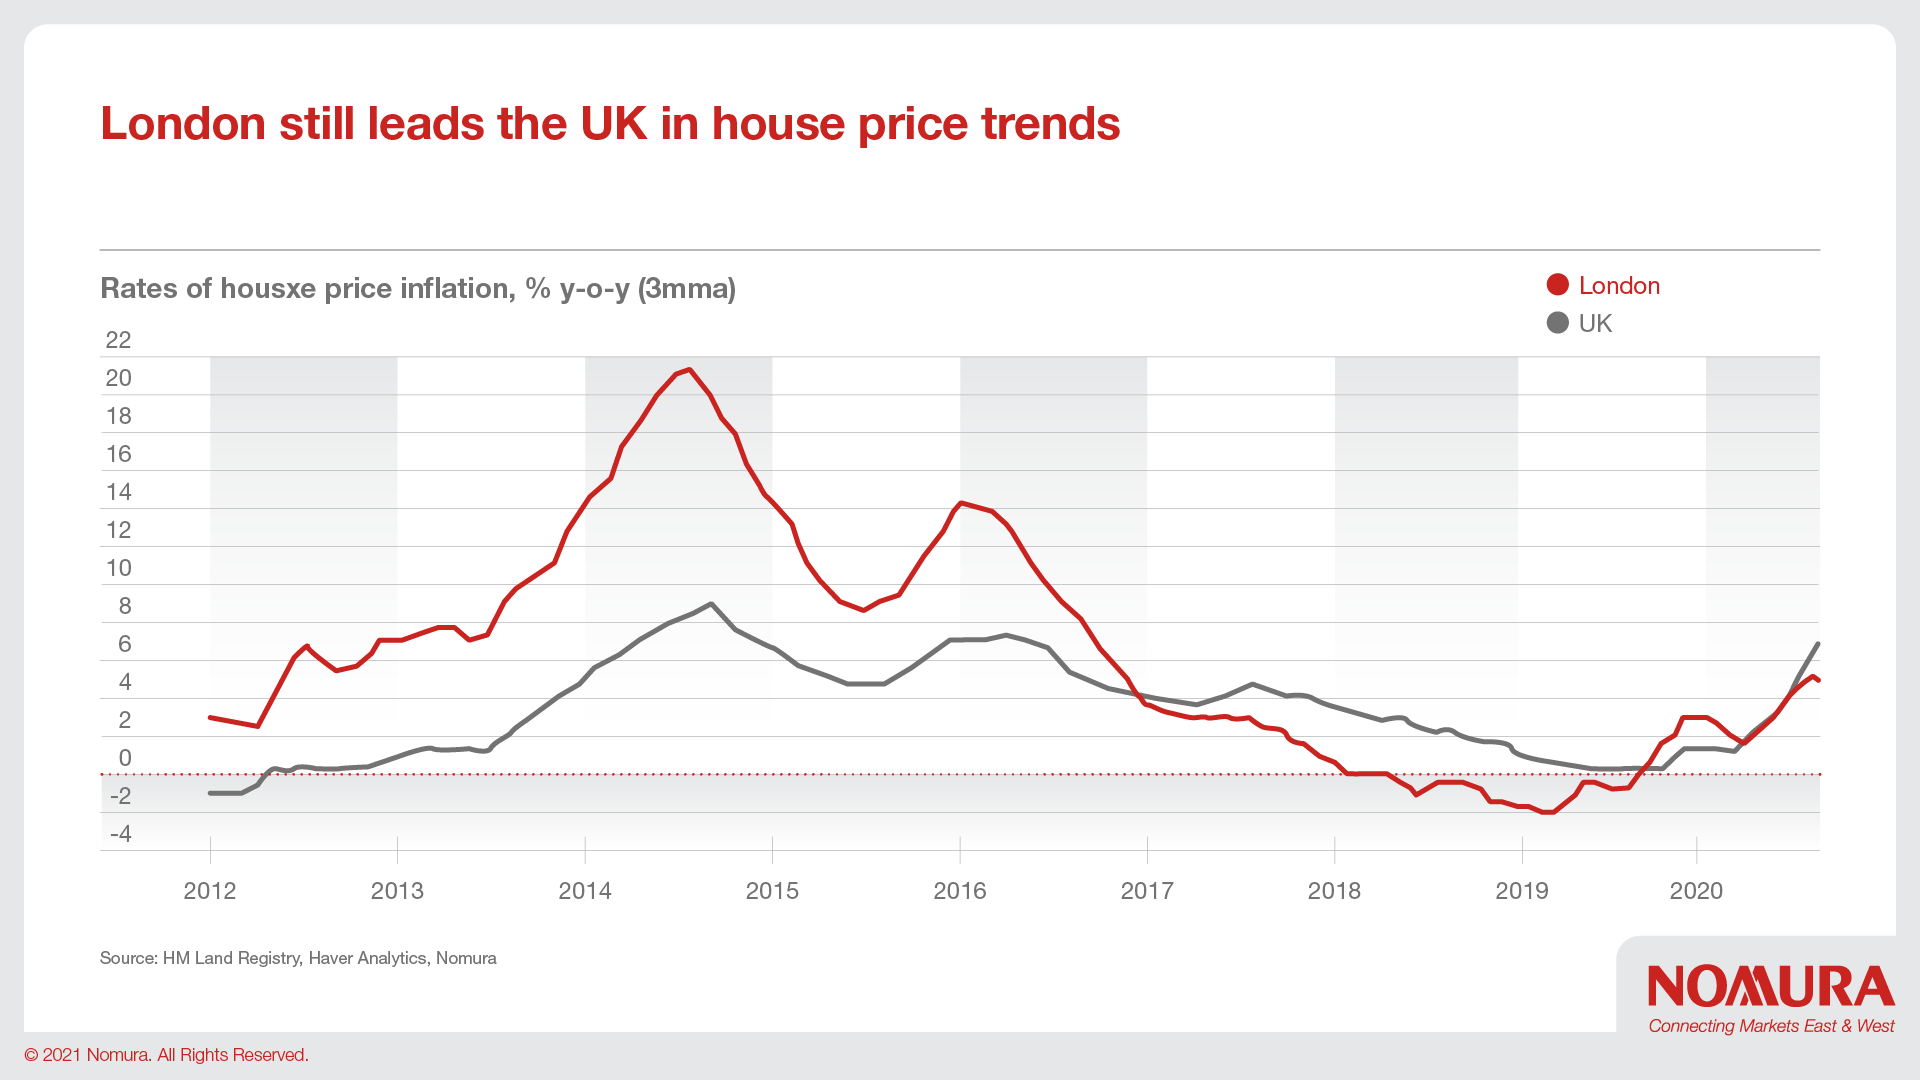
This rise in UK house price inflation has been widespread across the UK, with only two notable exceptions, London and Northern Ireland, where the rise in house price inflation has been less so. In London this is due to the stamp duty cut having less of a percentage impact (due to higher price levels). In Northern Ireland, more obvious Brexit concerns might explain some of this.
It is worth noting before we look ahead London tends to lead the rest of the UK when it comes to house price movements (the ripple effect). As the chart below shows, London house price inflation started moving up first in 2019 (albeit from lower rates) followed by the rest of the UK.
However, it’s important to consider the fact that many transactions that would otherwise have been carried out in 2021 had already been brought forward to the second half of 2020 to take advantage of the tax holiday extension.
Further to this, the RICS residential housing survey, which records monthly changes in various activity measures, reported the agreed sales, buyer inquiries and instructions to sell balances all fell into negative territory in January having declined from their peaks reached in the summer of 2020.
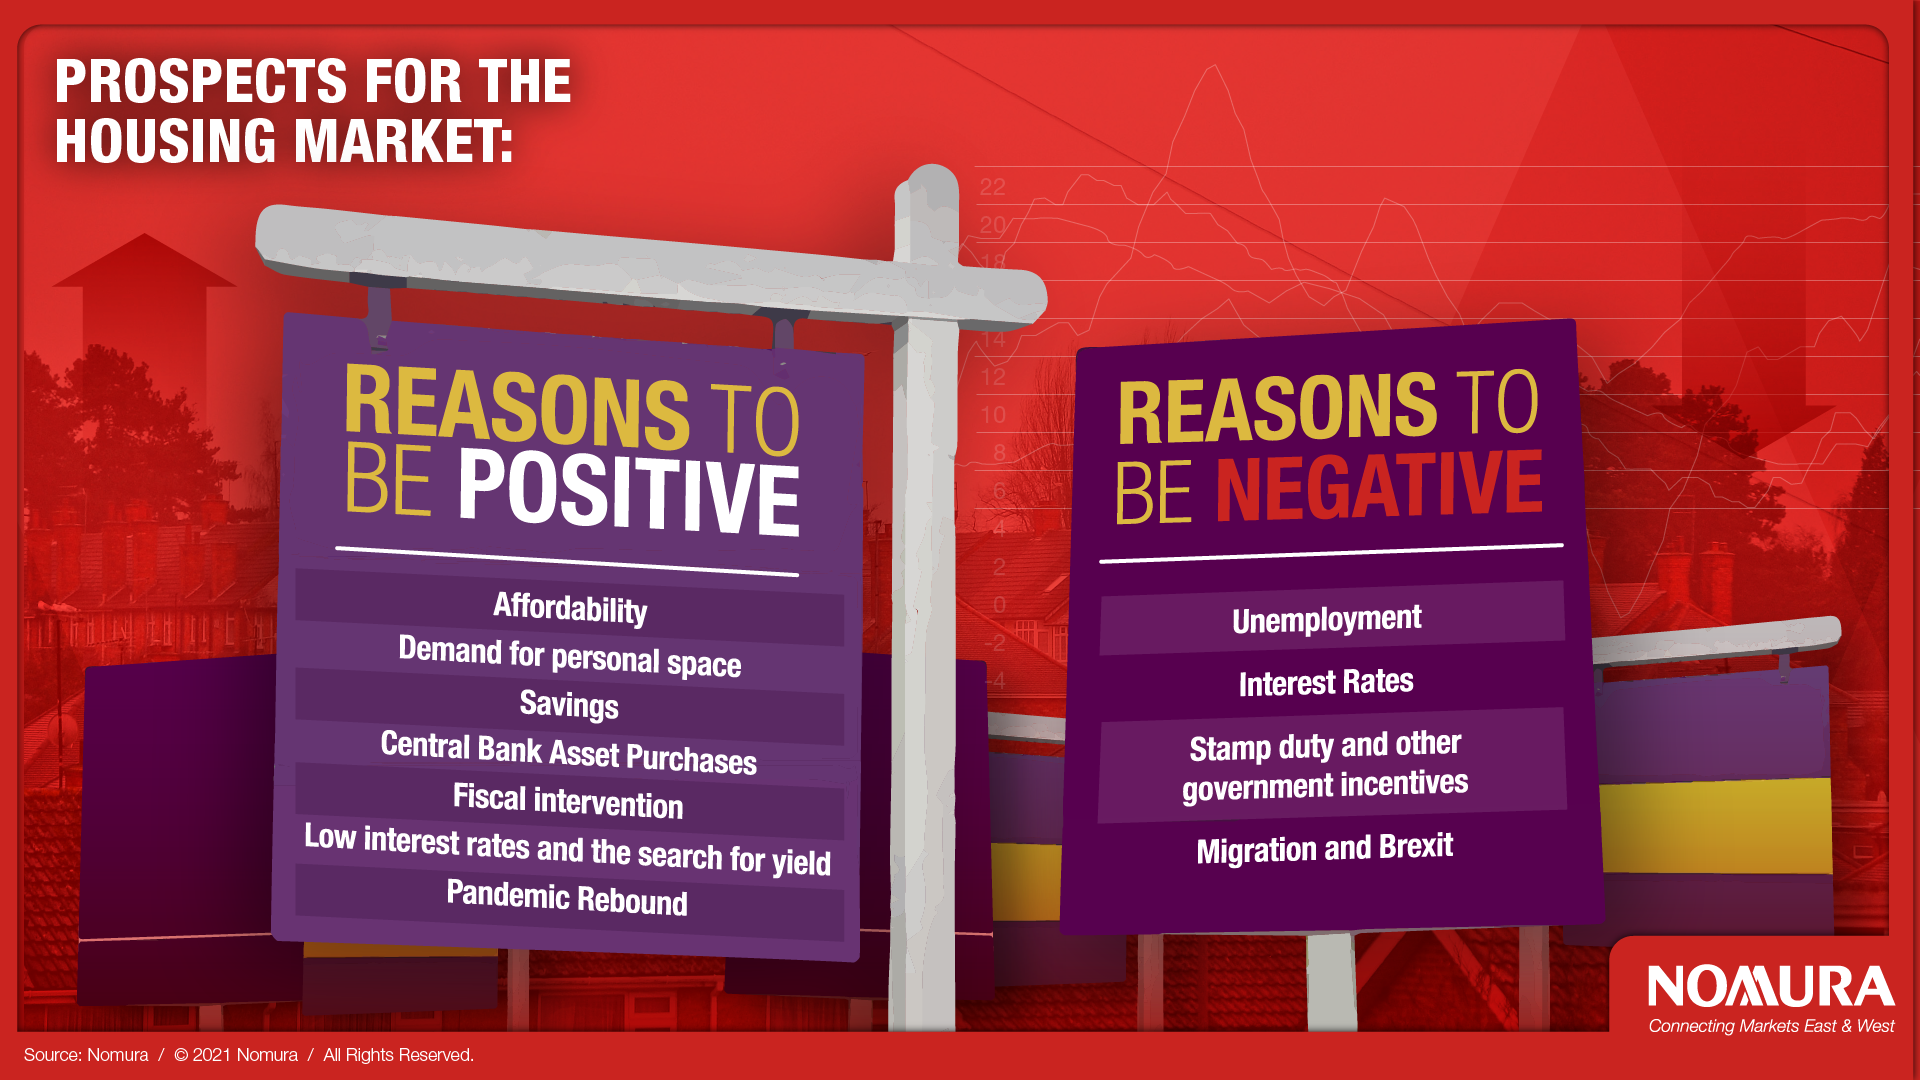
The outlook feels more balanced than it did just a few months ago, not least because of the Chancellor’s decision to extend the stamp duty holiday, the rise in mortgage interest rates having been partly reversed, vaccinations having continued apace and expectations for the economic outlook having rebounded noticeably. In what follows we take a look at the positives for the housing market this year before coming on to the downside risks later on.
Affordability - Of course there are substantial regional differences in affordability across the UK – so much so that the notion of a single measure of “UK affordability” is somewhat of a misnomer. But at the most basic level, UK housing affordability still looks encouraging on average. There are of course many ways to measure affordability. Be it price/income ratios, which can be helpful in that they tell us something about the ability of first-time buyers to get a mortgage.
Our preferred measure of affordability is the repayment/income ratio -– the latest year for which we have the income data from is 2019 – it suggests that housing was more affordable than at any time for the past two decades!
More recently, house prices rose in 2020, but offsetting that move in terms of affordability has been the fall (on average during the year relative to 2019, at least) in effective mortgage rates.
This reflects what’s been a long-term trend in the housing market more generally – that lower mortgage interest rates at the same time we’ve seen rising house prices, have effectively capped the repayment/income ratio over time. This is often termed the “recapitalisation” effect – the notion that lower interest rates have been “capitalised” into rising house prices to such an extent that one has completely offset the other, leaving the repayment/income ratio not far from its long-run average.
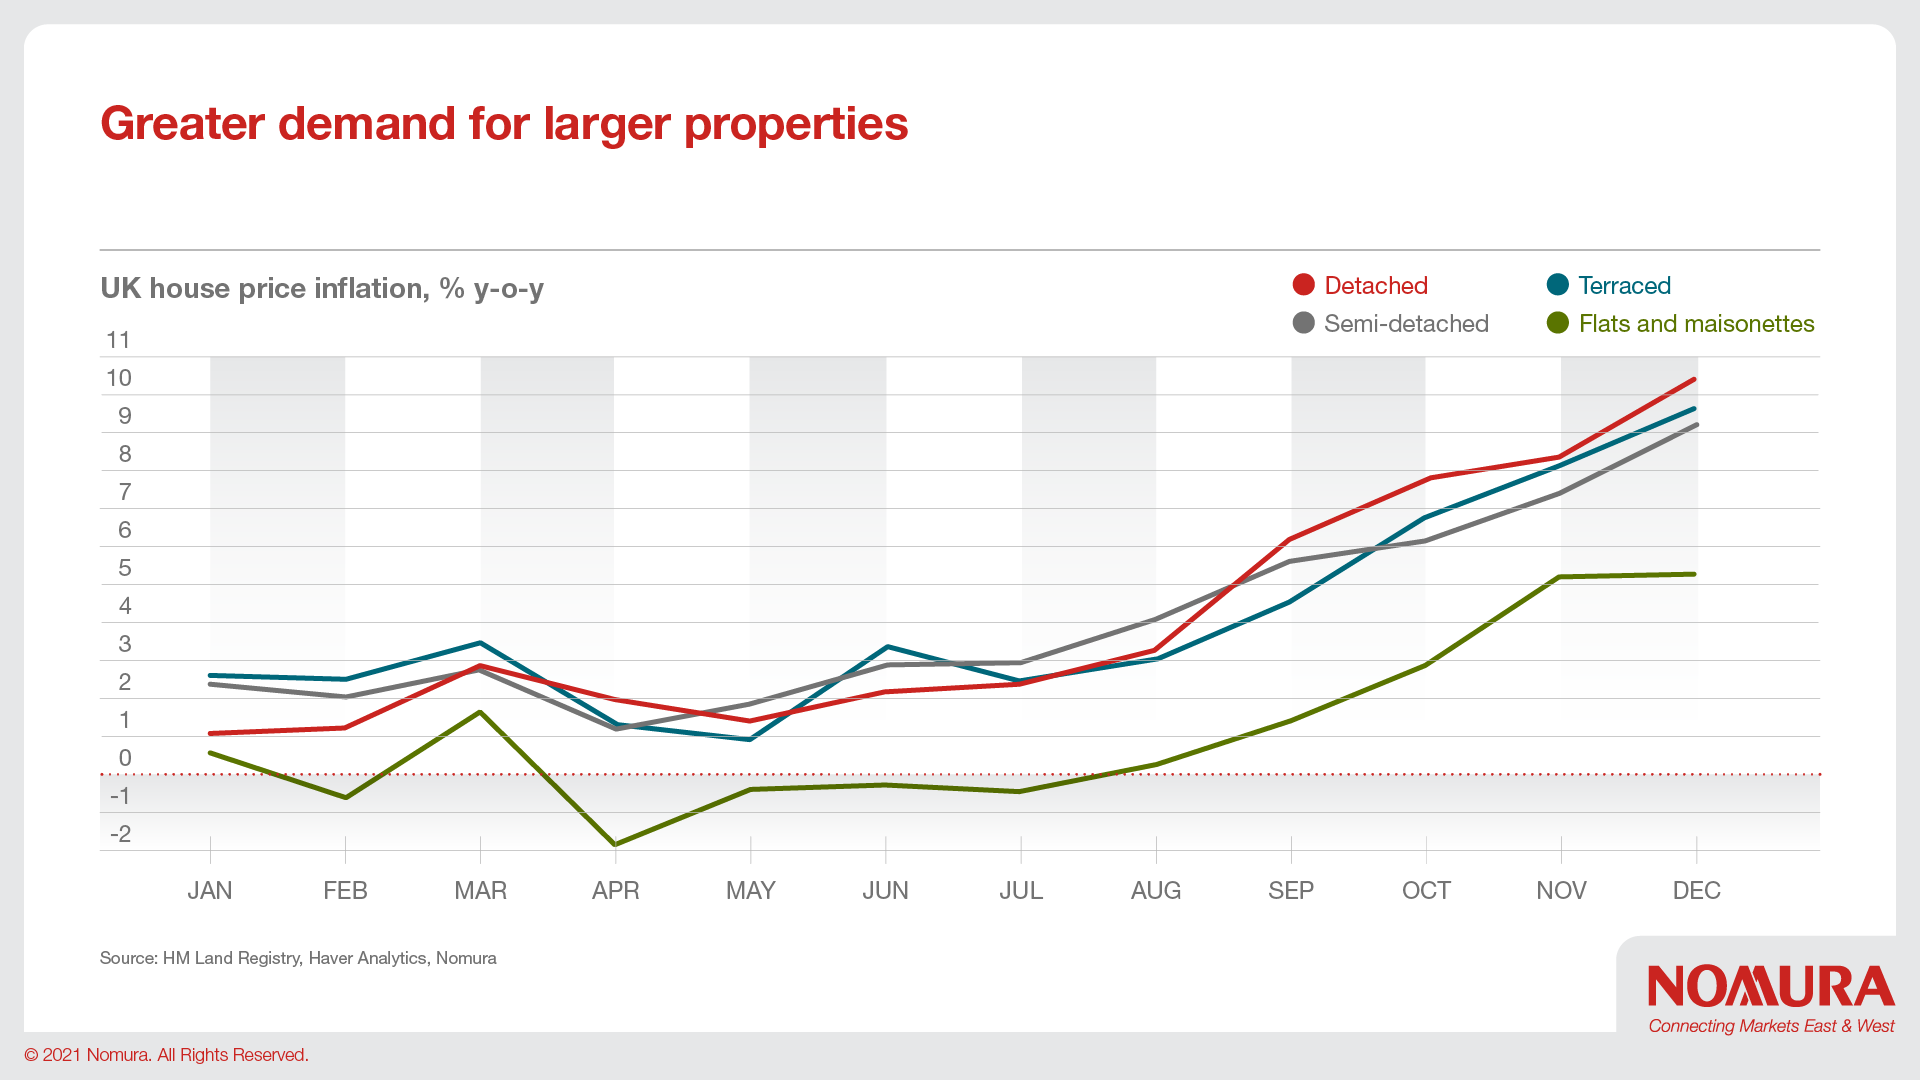
Demand for (and supply of) personal space - The pandemic appears to have generated an increase in demand for personal space, understandably with a) more employees working from home and b) possibly a more general desire by households to be less tightly packed into confined spaces (blocks of flats, for example) with a highly contagious virus on the loose. This can be seen in the chart below which shows the prices of houses (especially detached) have risen at a faster rate during the pandemic than that of flats.
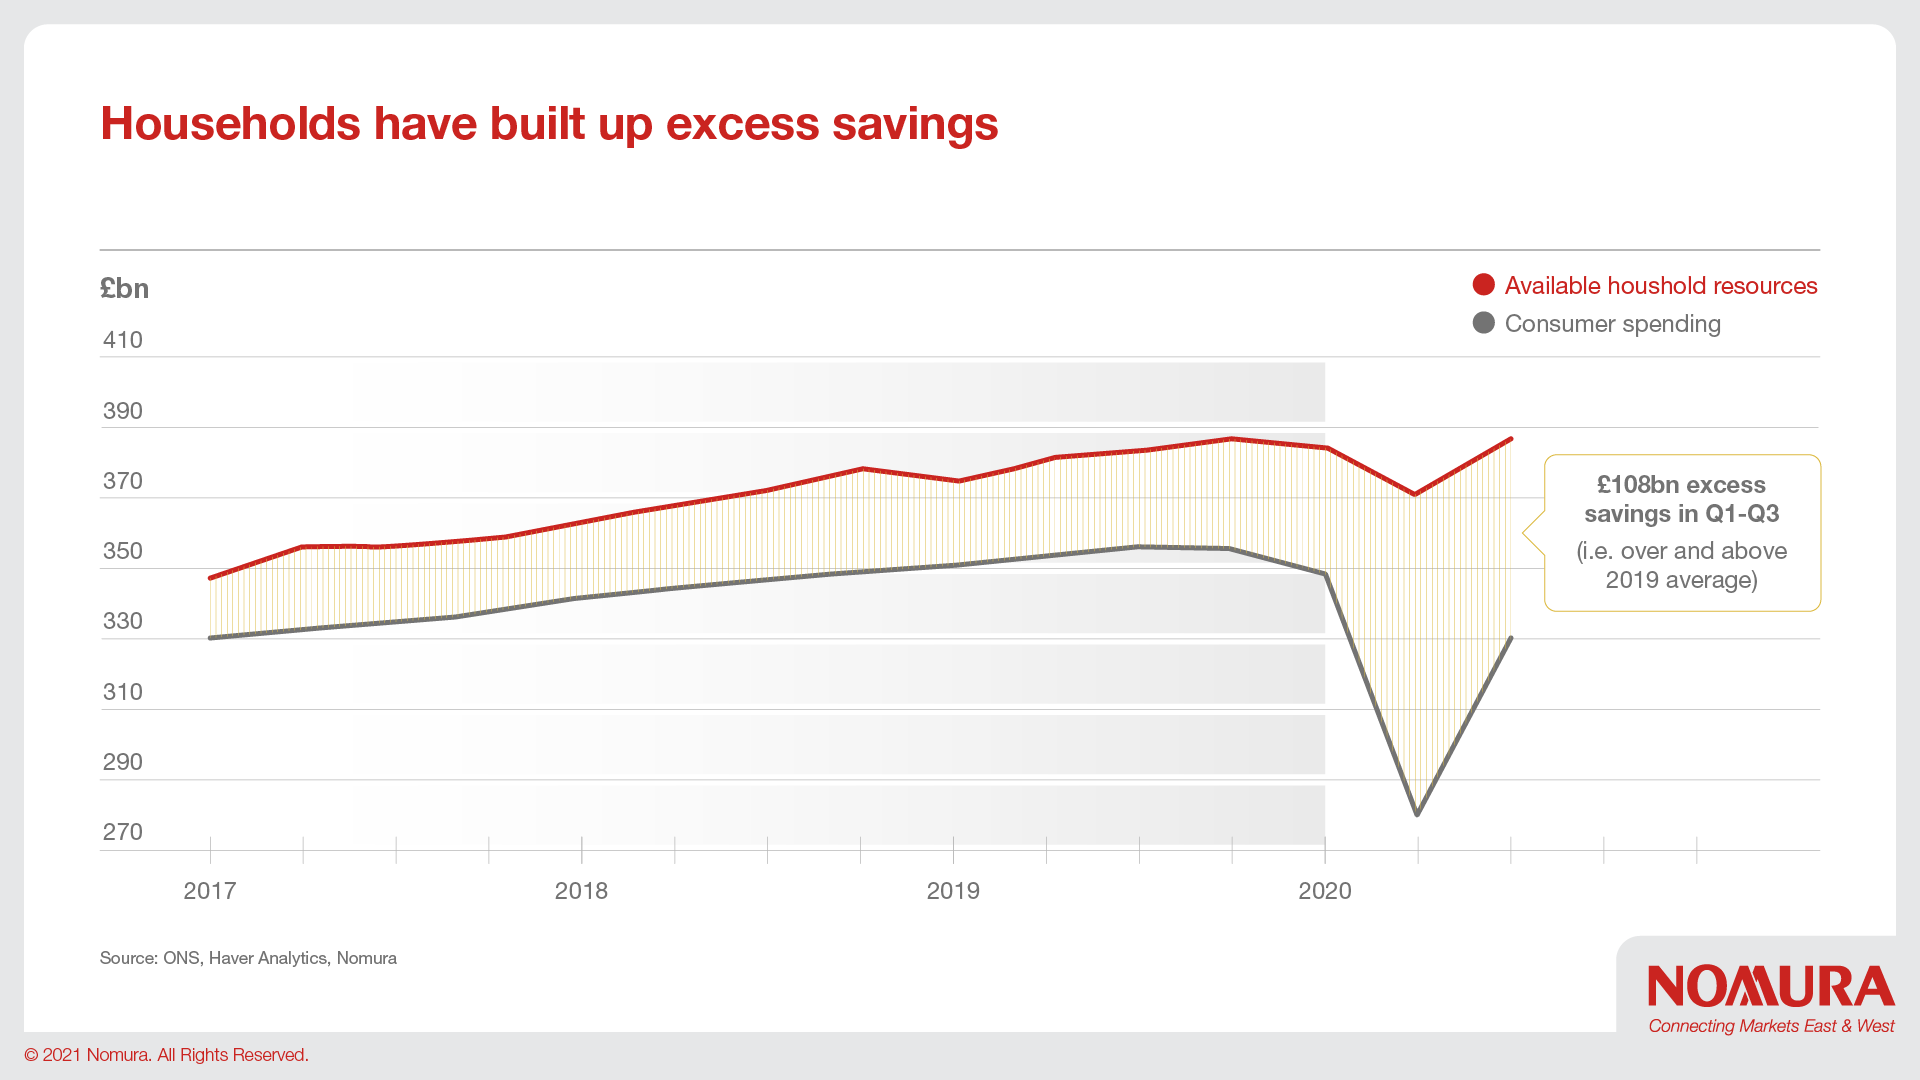
Savings - Over the past year since the pandemic hit, households (in aggregate at least) have seen their holdings of cash increase markedly. This has resulted from the government’s enforced lockdown, reducing the ability of households to spend while at the same time incomes have been protected through the Coronavirus Job Retention (furlough) Scheme (CJRS). This could be important for the housing market to the extent that it provides the resources for the deposits that are required when purchasing a house.
Central bank asset purchases - Money printing by central banks globally might be expected to lift the prices of all assets, not only those they target (government and corporate bonds in the UK, for example). There are a number of channels through which this may operate, including: lowering the yield on risk-free assets, which should ultimately feed through to the cost of mortgage finance, increasing the availability of credit by replacing financial institutions’ holdings of gilts with central bank cash, and lowering sovereign bond yields, which makes housing look relatively more attractive as an asset (the search for yield).

Fiscal intervention – There is of course the previously mentioned extended stamp duty tax breaks on UK houses between £125k and £500k, but there is also the 95% Loan to Value (LTV) mortgages, a guarantee for which lenders will be expected to pay a “commercial fee”. The way in which this will work is similar to that of the ‘Help to Buy’ mortgage guarantee offered by the Treasury between 2013 and 2016. Basically in the event of a default, where the recovery value of the house is less than the purchase price, the borrower pays the first 5% (in the form of their lost deposit), the next 15% of loss is shared by the government and lender (in the proportions 95% and 5% respectively) and any losses over and above this (i.e. when the value of the property recovered is less than the 80% lower limit) is a loss to the lender.
Low interest rates and the search for yield - We’ve talked about this in the context of affordability and asset purchases above. As global interest rates have fallen, investors have searched for alternative investment opportunities outside of the financial sector, including residential real estate. Notwithstanding the pandemic seemingly having led to a potential desire for more space in rural rather than city settings, the search for yield could benefit those locations that are more ‘internationally tradeable’ and have a greater stock of accommodation that lends itself more to rent.
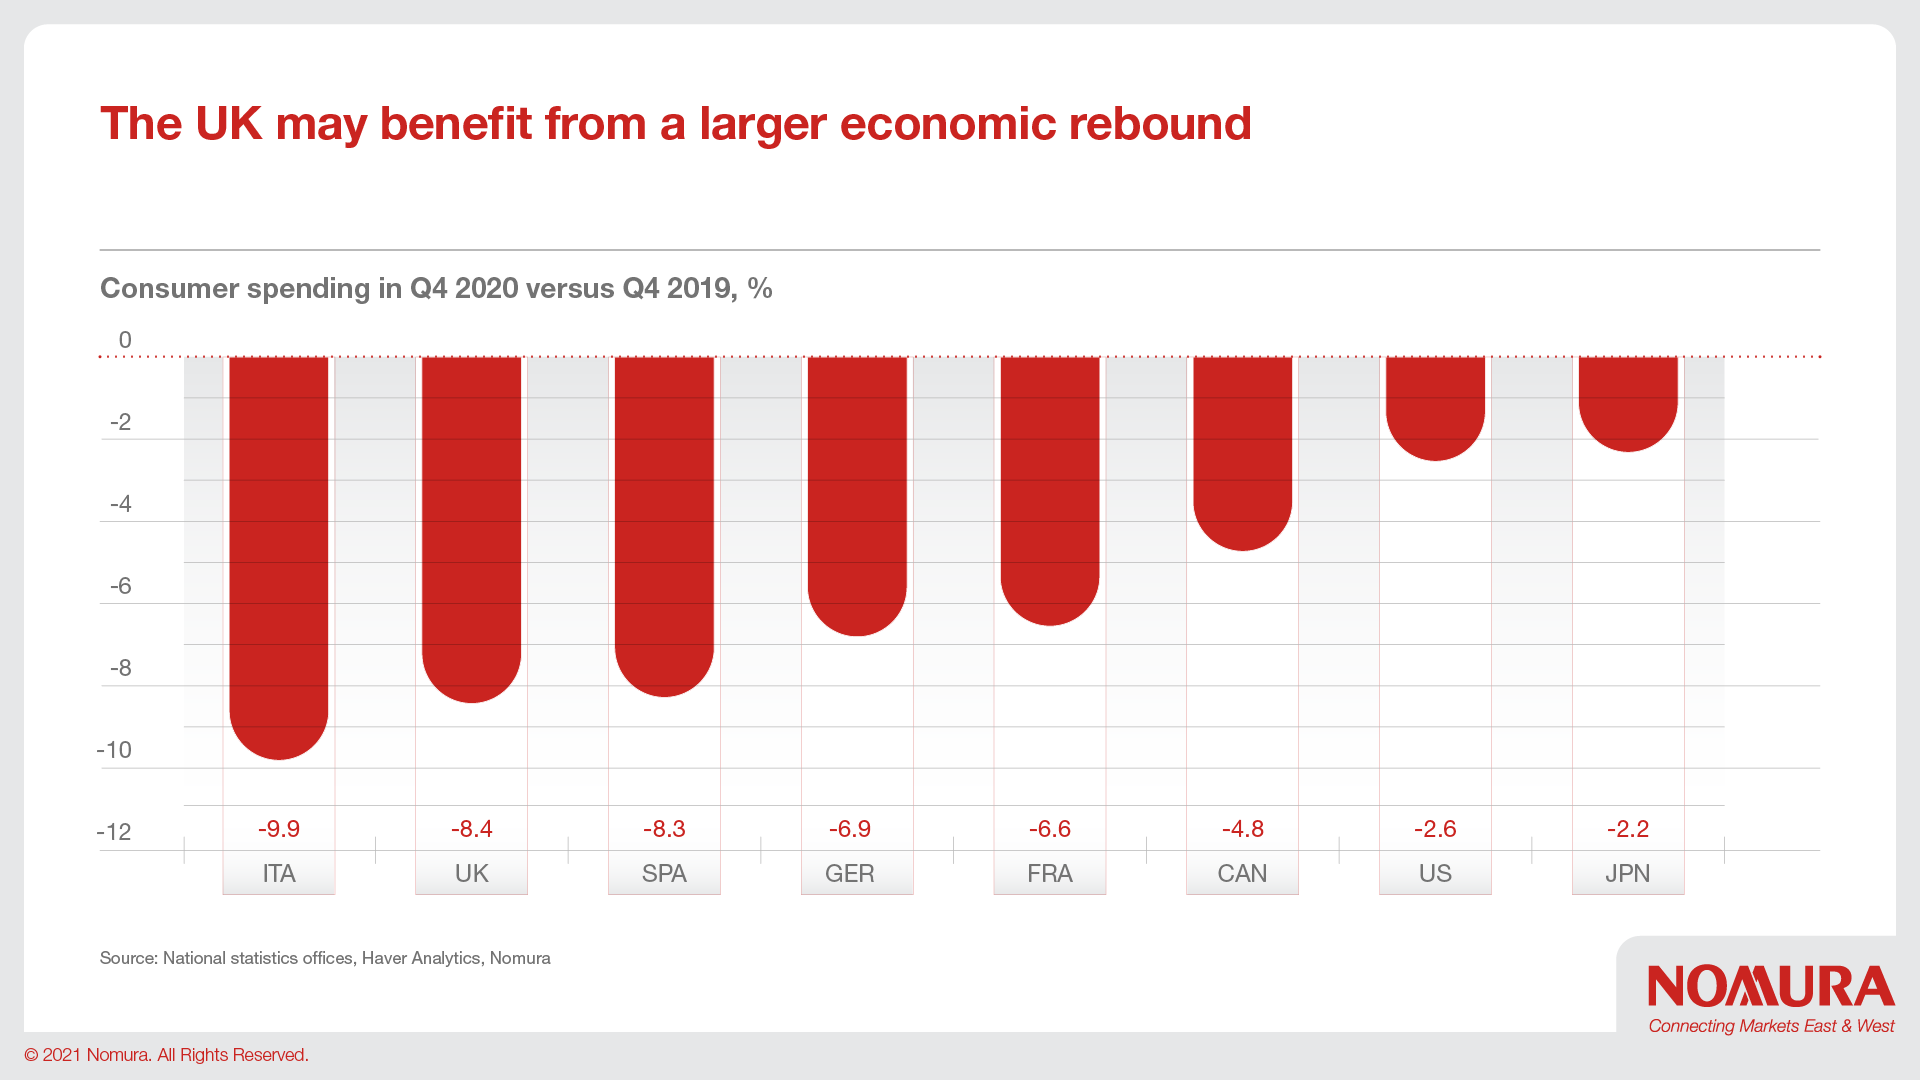
Pandemic rebound - The UK has suffered more than most other countries during the pandemic. Consumer spending was down by more than most of its peer group countries as seen in the chart above. At the same time employment has been preserved by the furlough scheme, and vaccinations are progressing at a far faster pace than elsewhere in Europe. While we expect it to take some time before UK GDP regains its pre-pandemic peak, as restrictions are lifted speedily (assuming the government’s roadmap remains intact) this should support consumer spending and the housing market – with movements in consumption and house prices typically being highly correlated.
Unemployment - Unemployment seems likely to rise further, especially as the furlough scheme is retired. From its current level of 5% the BoE expects the unemployment rate to peak at around 7.8% in Q3 this year. A higher rate of unemployment or a fall in employment is likely to lead to lower household incomes, which in turn stretches affordability. In order to keep the repayment/income ratio the same following a fall in incomes, we would need to see a fall in house prices. However, it is worth noting that the BoE does not expect the rise in the unemployment rate to prove a permanent feature. The Bank expects it to fall back to 4.5% by the end of its forecast horizon (early 2024).
Interest Rates - Another key component of the repayment/income ratio is the mortgage interest rate. One way to look at this is: the higher mortgage rates are, the greater the decline in house prices required to leave this measure of affordability unchanged, ceteris paribus.
Stamp duty and other government incentives – But wait a minute – wasn’t this one of our positives? For sure the extension of the stamp duty holiday period until the end of June/September should be supportive for the market. But to the extent that potential house buyers believed the initial announcement of the stamp duty holiday was time-dependent and would not be extended, housing transactions that might otherwise have been undertaken in the remainder of 2021 would have been brought forward into the second half of last year and early 2021.
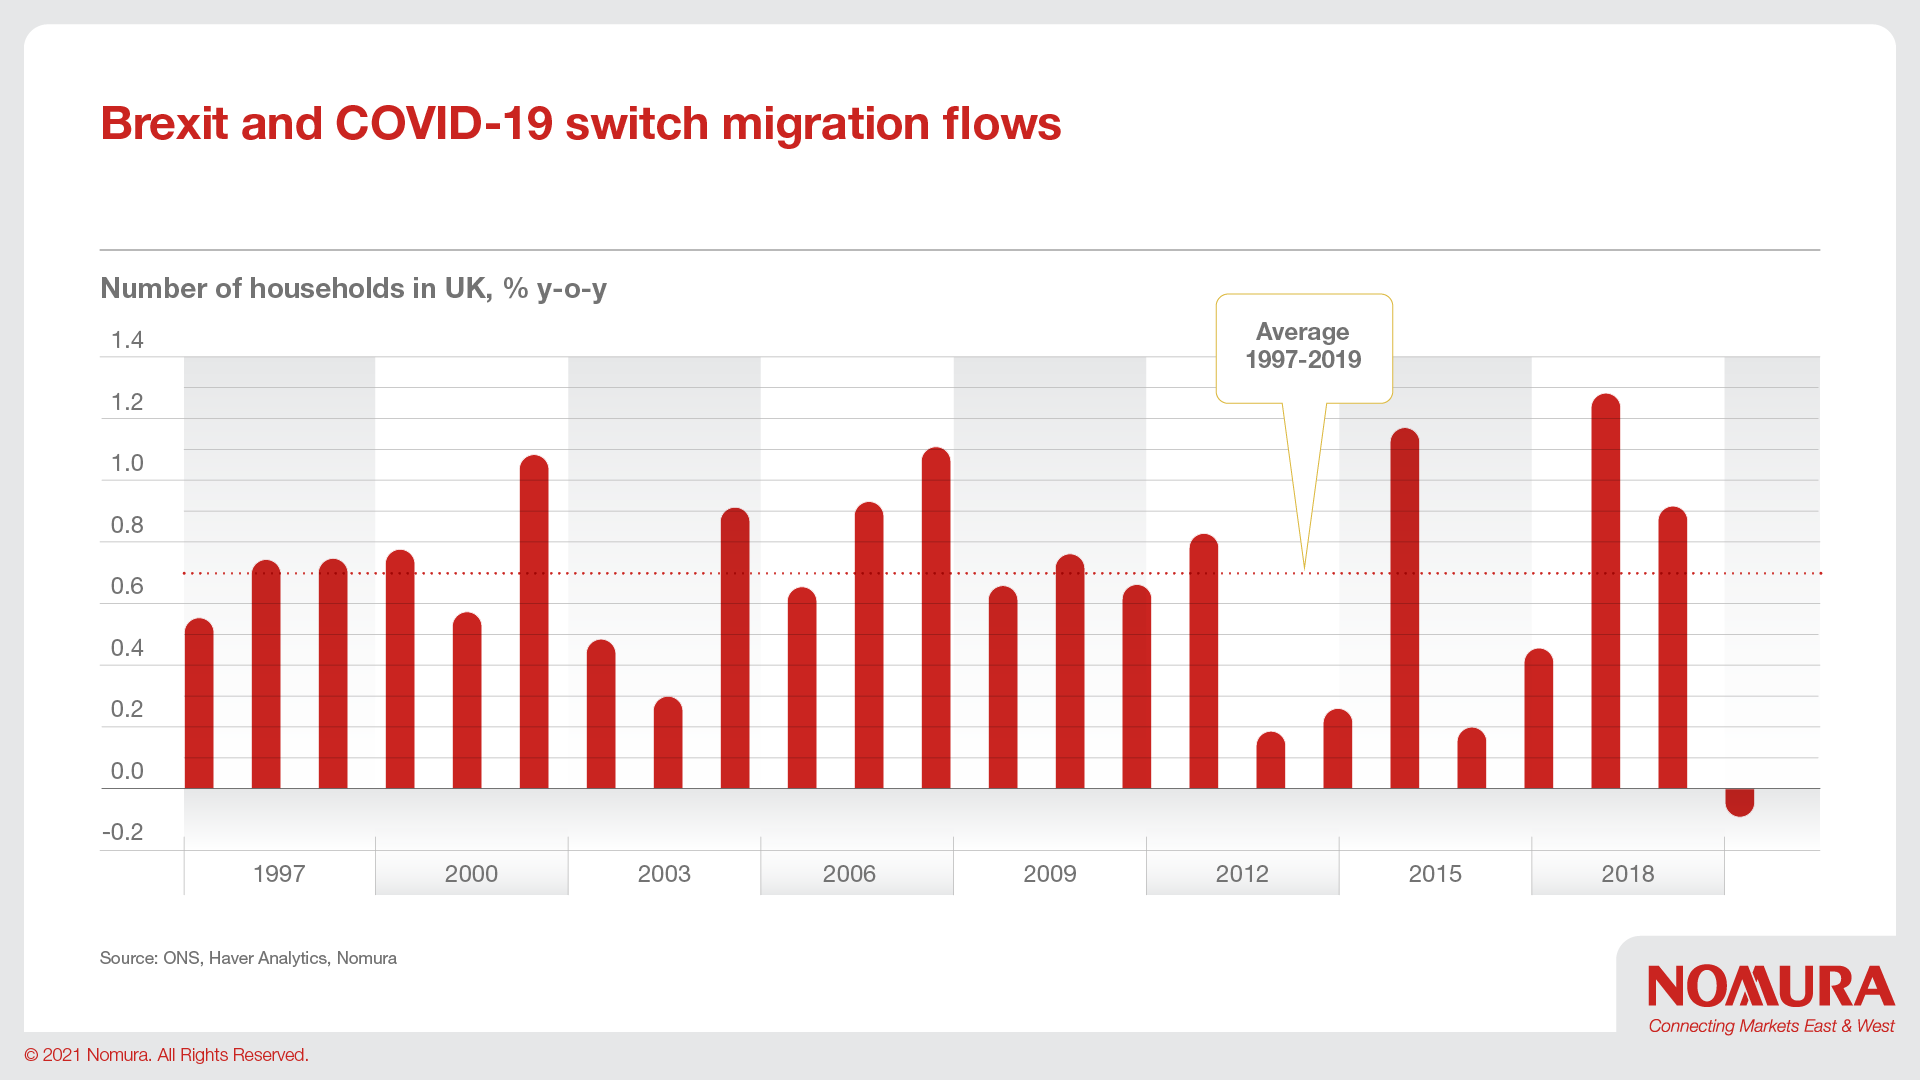
Migration and Brexit - There are a number of reasons that net inward migration might have fallen/turned negative. One is Brexit, and with it the UK’s new immigration system that puts an end to the free movement of people between the UK and the European Economic Area, there is likely a decline in demand for UK properties. However, it is difficult to assess what’s happening to migration currently because of the pandemic- related suspension and disruption to the main sources of data, including the International Passenger Survey, or IPS.
Read the full article on UK Perspectives: Boom or bust in the UK housing market?

Chief UK & Euro Area Economist
This content has been prepared by Nomura solely for information purposes, and is not an offer to buy or sell or provide (as the case may be) or a solicitation of an offer to buy or sell or enter into any agreement with respect to any security, product, service (including but not limited to investment advisory services) or investment. The opinions expressed in the content do not constitute investment advice and independent advice should be sought where appropriate.The content contains general information only and does not take into account the individual objectives, financial situation or needs of a person. All information, opinions and estimates expressed in the content are current as of the date of publication, are subject to change without notice, and may become outdated over time. To the extent that any materials or investment services on or referred to in the content are construed to be regulated activities under the local laws of any jurisdiction and are made available to persons resident in such jurisdiction, they shall only be made available through appropriately licenced Nomura entities in that jurisdiction or otherwise through Nomura entities that are exempt from applicable licensing and regulatory requirements in that jurisdiction. For more information please go to https://www.nomuraholdings.com/policy/terms.html.

Jump to all insights on Economics
Rates | 5 min read June 2021
Economics | 0 min podcast April 2021